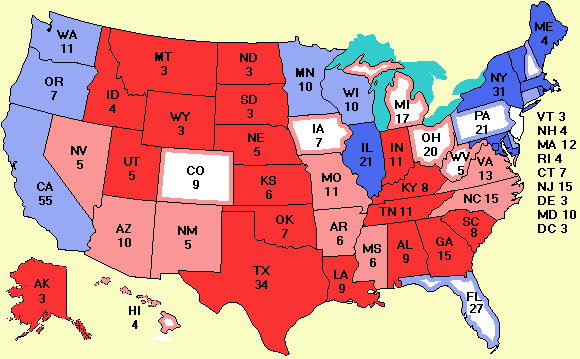
Electoral Vote Predictor 2004: Kerry 243 Bush 280
|
|
| Oct. 30 | New polls: CA CO FL GA IL IA MI MN NV NH NJ NM NY OH PA TX UT WA WI |
 |
News from the Votemaster
We have a record 44 polls today. If this keeps up we are soon going to have more polls than there are states. Florida wins with seven new polls today. By Tuesday we may be able to make a pretty decent Gaussian distribution just from the daily Florida polls. The most recent Florida poll, from Zogby puts Kerry ahead there 47% to 45%, with a margin of error of 4%. Yesterday he was behind by 1% there, so this is a jump of 3% in one day for Kerry. Of the seven Florida polls, four put Bush ahead and three put Kerry ahead. It is as close as it could be there.
Kerry has also pulled ahead again in Pennsylvania, 47% to 44%. yesterday it was tied at 47% each. However, Bush has now pulled ahead by 1% in Ohio, a gain of 4% from yesterday. Bush has also edged ahead in Colorado (by 1%) and Iowa (by 1%). According to Strategic Vision (R), New Jersey is tied, but to correctly interpret a Strategic Vision poll, you have to subtract about 4% or 5% from Bush's score, so although I have included it on the map in my effort to bend over backwards to be impartial. New Jersey is really safe for Kerry and the map score should really be Kerry 258, Bush 280.
To get a better idea of what you can believe and what you can't, a good starting place is the sum of the strong and weak states given in the map legend. Currently Bush leads slightly with 218 votes in the electoral college. Kerry has 191, and 129 are up for grabs. It could go either way.
Since Zogby is polling all the swing states every day now, the map is getting a bit one sided. Also, many of the pollsters are clearly partisan, monkeying with the data to make it look like their horse is ahead. There is no reason to doubt Zogby's honesty or accuracy, but it would be better to look at multiple pollsters. Consequently, I have made a new map that excludes the pollsters that admit they only work for one side. It does include pollsters like Gallup, which is officially neutral but appears to be including far too many Republicans in the samples. This new map always includes the most recent poll in each state, and then goes back up to 3 days to look for other polls to average in. A given pollster is used at most once and partisan pollsters are not used at all. The new map and spreadsheet use the suffix 'z' and are on the menu under the name Averaged polls. It gives a score of Bush 263 to Kerry 248, but remember, tiny shifts in a few states can alter this score radically.
Here is an update on yesterday's Zogby tracking poll. Kerry has pulled even with Bush. Each one is polling 47%. Four years ago, Gore was behind Bush by 3% at this point in the campaign, yet he ultimately won the popular vote. There is less room for movement tis time because there are fewer undecideds, but it is always possible that some voters will change their minds due to events occuring in the U.S. or abroad.
| Candidate | E-10 | E-9 | E-8 | E-7 | E-6 | E-5 | Final |
| Kerry | 46% | 45% | 46% | 47% | 46% | 47% | |
| Bush | 48% | 48% | 49% | 48% | 48% | 47% | |
| Nader | 1% | 1% | 1% | 1% | 1% | 1% | |
| Other | 1% | 1% | 1% | 0% | 1% | 2% | |
| Undecided | 4% | 5% | 3% | 3% | 4% | 3% |
Now look at the same time period for the 2000 election, plus the final results.
| Candidate | E-10 | E-9 | E-8 | E-7 | E-6 | E-5 | Final |
| Gore | 43% | 42% | 42% | 41% | 42% | 42% | 48.38% |
| Bush | 44% | 45% | 45% | 46% | 45% | 45% | 47.87% |
| Nader | 5% | 5% | 5% | 4% | 5% | 5% | 2.74% |
| Other | 1% | 1% | 1% | 2% | 1% | 1% | 1.01% |
| Undecided | 7% | 7% | 7% | 7% | 7% | 7% | 0% |
Zogby wasn't the only one predicting a big win for Bush at this point four years ago. On Oct 29, 2000, Gallup released a poll showing Bush ahead 49% to 42%. In the early days of November 2000, Zogby correctly noted a sharp trend towards Gore as the undecideds finally bit the bullet. Zogby ended up predicting Gore would narrowly win the popular vote. Gallup stayed the course and ultimately predicted that Bush would win the popular vote by 2%. Of course, we now know Gore won the popular vote by about 0.5%.
If you are looking for a map where the area of each state is proportional to the number of votes it has in the electoral college, see the Cartogram link on the menu.
Projected Senate: 46 Democrats, 52 Republicans, 1 independent, 1 tossup
| Click here to tell a friend about this site. |


|
To bookmark this page, type CTRL-D (Command-D on Macintoshes). If you are visiting for the first time, welcome. This site has far more about the election than just the map. See the Welcome page for more details.
|
|
