
Electoral Vote Predictor 2004: Kerry 211 Bush 327
|
|


| Sept. 18 | New polls: CO IL IA MO OH PA |
 |
 Welcome
 FAQ
FAQ Donations
 Electoral college
 Electoral college graph
 Political humor
 Political websites
 Articles and Books
 Kerry and Bush records
 Americans abroad
 Foreign nationals
 About RSS feeds
  Enhancements
 News from the Votemaster
Be careful what you wish for. You might get it. When you ask a question to 250,000 people, you might just get 250,000 replies. Keep that in mind if that situation ever arises. But boy, do I know a lot about cell phones now. More about that below.
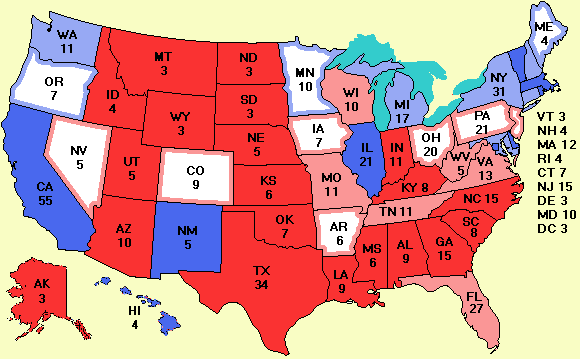
Six new polls today, but nothing really spectacular. A Research 2000 poll in Illinois gives Kerry a 15% lead, much closer to the conventional wisdom than the 4% lead I had yesterday. Bush appears to be increasing his lead in Missouri. It was 2% but is now 7%. Finally, in the 7-day Rasmussen tracking poll in Ohio, Bush is slightly ahead again, but within the margin of error.
As I have pointed out before, the states with a white core on the map are all tossups. To get an idea of where we really stand, you should add the strong and weak numbers for each candidate in the legend (there is no room on the map for these values and doing two sums a day will keep your mind sharp). Doing this, we see Bush is ahead 244 to 190, with 104 votes in the electoral college up for grabs. While 54 votes is a decent lead, it could easily wiped out by a change in the tossup states with 104 EVs. Another way of looking at this is to check the Barely Kerry and Barely Bush numbers in the legend. Bush is credited with 83 votes in the electoral college that he doesn't have in the bag while Kerry is credited with only 21. This means that a tiny shift towards Bush will not cost Kerry much but a tiny shift towards Kerry will cost Bush a lot. Nevertheless, there is no question that if the election were held today, Bush would win. For the election on Nov. 2, it is still a tossup.
Continuing on yesterday's theme of whether polls mean anything in the world of cell phones, let me first thank all the people who took the time to respond, in some cases at great length. Let's start the story at the beginning. How do pollsters decide who to call? The simplest way to get a random sample is to pick the area code and exchange to be sampled and have the computer dial the last four digits at random. In the trade this is called RDD--Random Digit Dialing. It is very easy to do but unfortunately has some problems. Many numbers will be business phones, hospitals, police stations, teenagers, and other undesirables. Also, with number portability, the pollster may be getting Manhattan, KS instead of Manhattan, NY. Consequently, RDD is not used much any more.
Instead, pollsters buy lists of phone numbers. In some states, the government sells voter lists. In other states, lists of residential customers can be purchased from telephone companies. Commercial companies also sell lists. There are many sources. These are commonly used. Pollsters do not want to call cell phones for several reasons: First, cell phone users may be in meetings, restaurants, cars, or other places where they are not free to talk. Second, since cell phone users are usually paying for air time, they don't want to waste it and might break off half way, resulting in a useless interview. Third, that number in Colorado the pollster called may actually be a student who took her cell phone to college in California. Fourth, sound quality may be poor and questions or answers may be misunderstood.
Fifth, and most important, it might cost the pollster a lot of money: automated calling of cell phones is illegal in the United States and there is a substantial fine for breaking the law. US Code Title 47, Chapter 5, Subchapter II, Part I, Sec. 227 reads:
It shall be unlawful for any person within the United States--
(A) to make any call (other than a call made for emergency purposes or made with the prior
express consent of the called party) using any automatic telephone dialing system or an
artificial or prerecorded voice--
(iii) to any telephone number assigned to a paging service, cellular telephone service, specialized mobile radio service, or other radio common carrier service, or service for which the called party is charged for the call.
On the positive side, pollsters are exempt from the "Do not call" list, but most people do not know that.
But using land lines is no bed of roses either. Many people use caller ID or their answering machine to do call screening. Busy young professionals are rarely home from work before 11 p.m. whereas lonely old people are only too happy to talk to the nice young girl who seems to care about what they think. Calls made at 2 p.m. are going to oversample housewives, and so on. All these effects lead to biases. To correct for them, pollsters conduct exit polls of voters leaving the polling place on election day to get a good idea of the statistical make up of the electorate for next time. These data are used to correct the polls. For example, if the exit polls show that 10% of the voters in some state are African Americans and in a state poll of 600 people by accident only 30 are African Americans (5%), the pollster can just count each African American twice. This process is called normalization. It was proposed for use to correct undercounts in the 2000 census but was rejected by the courts on the gronds that the constitution calls for an "enumeration" of the population, not a statistical model of the population.
Exactly what to normalize for is a controversial issue. Should the pollster make sure his poll has the statistically correct number of Catholics, gun owners, retirees, veterans, immigrants, union members, millionaires, welfare mothers, fat people, lesbians, and [fill in your favorite category]? Where do you draw the line? More specifically, should the pollster normalize to make sure the effective number of Democrats and Republicans is correct? Some pollsters do and some do not. And how many is correct? Gallup is currently normalizing to 40% Republicans and 33% Democrats which some pollsters think is highly unrealistic, which explains why Gallup's polls show Bush doing so well.
As we reported earlier, in an extraordinary step, both John Zogby and Scott Rasmussen criticized Time and Newsweek for also having too many Republicans in their samples. Zogby said: "If we look at the three last Presidential elections, the spread was 34% Democrats, 34% Republicans and 33% Independents (in 1992 with Ross Perot in the race); 39% Democrats, 34% Republicans, and 27% Independents in 1996; and 39% Democrats, 35% Republicans and 26% Independents in 2000." Thus a score of Bush 52%, Kerry 40% doesn't necessarily mean of the 1000 pollees, 520 will vote for Bush, 400 will vote for Kerry and 80 will vote for someone else or are undecided. It might mean this is the result of weighting the Republican votes to force them to represent 40% of the sample.
Now getting back to Breslin's column, in theory he is right that pollsters will miss people who have only a cell phone, but of the 169 million cell phones, most have a land line as well. It is estimated that 5% of the population is cell only. And most of these don't live in battleground states. And then an effect occurs only if cell-only users differ from land line users in their political preference. Thus the error introduced by missing the cell-only customers is probably smaller than the error introduced by missing the overseas voters. But it is there and in a close election, it could matter. Here is Zogby's response to Breslin's column. Robert Landauer wrote a good piece on the accuracy of polling is his Aug. 31 column. Worth a look.
In the future, when many more people cut the cord, the effect will become so large it can no longer be ignored. New polling methods will be required. In this respect, Zogby is a pioneer with his e-mail polls. Of course, these have a similar selection effect--not everybody has a computer. To get around this effect Zogby normalizes the results, but has the same normalization problems everyone else does. Although the mathematics of statistical sampling are rock solid, the methodological concerns of how to get a truly random sample of the target population (assuming you can figure out what the target population is) loom large.
What is the target population, anyway? In principle it is the people who will vote for president on Nov. 2. But how do pollsters know who will vote? Most pollsters have a screen designed to guess which registered voters will vote and which will sit it out. The formulas used for screening vary from pollster to pollster and are usually top secret. Some pollsters report two scores, those among all registered voters and those among likely voters. (Unregistered voters don't count, so it you are not registered, hurry up and register.) The media tend to focus on the likely voters, but as Albert R. Hunt points out in his article in the Wall Street Journal Sept. 17, "What if the Polls are Wrong," that is probably not the best predictor. Specifically, he writes: "In 2000, Gallup's, election eve survey showed George Bush ahead by two points among likely voters; he trailed Al Gore by a point among registered voters, very close to the final outcome." If using registered voters has better predictive value, even on election eve, I think people should pay more attention to it and less to the likely voters, especially when every pollster has his own homebrew formula for determining likely voters. Henceforth, when I have access to the registered voter results, I will use those in preference to likely voters, but when the pollster only reports likely voters, I will use those results. While this mixes apples and oranges, the fact that every pollster uses his grandmother's secret receipe for divining likely voters, means we already had fruit salad. Also, both sides are so worked up this year that everyone expects all kinds of unlikely people to vote, wreaking havoc with the old models for determining likely voters. Applying this new rule today for the first time, I put Bush a tad ahead in Pennsylvania because the Keystone Poll has him ahead by 2% among RVs although he is tied among LVs, with a MoE of 4%.
With Gallup now going from "the Gold standard" in polling to being highly controversial, many people are asking how much they can trust the various pollsters. For this reason, I have introduced a new feature to this website starting today: separate maps for each of the major pollsters. These maps will be accessible via the More data page. While it would be technically possible to allow users to produce personal custom maps excluding user-selected pollsters, the workload of generating 250,000 custom maps every day would bring the server to its knees, so I can't offer this feature. Sorry. However, the spreadsheet offers a close second choice. If you download the daily Excel spreadsheet and search for pollsters you don't trust and then add a couple of points to the Kerry or Bush column as you wish, the spreadsheet has been programmed to recompute the new electoral college score. All you have to do is enter the new numbers in the gray columns.
Although it is 7 years old, Gallup's FAQ on polling is still useful reading.
It has been a long story today, but understanding the limitations of polling is very important. It is my own feeling that the mass media don't have a clue. They keep harping on the national polls, which are only peripheral, and rarely, if ever, discuss the normalization for political party issue discussed above. They give the (highly misleading) impression that a score of, say, 49% to 41% means that 49% of the people polled were for the former candidate and 41% were for the latter. In reality, that result is the consequence of a lot of statistical massaging of the data based on a model that is rarely openly discussed.
Finally, some legal news. In a 6-1 decision, the Florida Supreme Court ruled that the Reform Party exists in Florida and that Nader can be on the ballot as its candidate. Nader also won a court case in Colorado, but lost in New Mexico.
Projected Senate: 48 Democrats, 51 Republicans, 1 independent
To bookmark this page, type CTRL-D (Apple-D on Macintoshes). If you are visiting for the first time, welcome. This site has far more about the election than just the map. See the Welcome page for more details.

|
|
