
Electoral College Graph
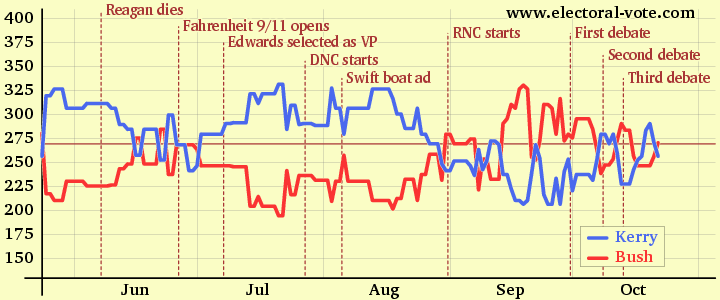
This graph shows the current number of electoral votes for each candidate since May 24, Remember that after some event is in the news, it takes several days before it is reflected in the polls. The brown horizontal line shows the 270 electoral vote mark needed to be elected president. The gray vertical lines show the boundaries between the months.
If you like this website, please link to it to improve its Google PageRank and tell your friends about it.