Senate Graph 2010
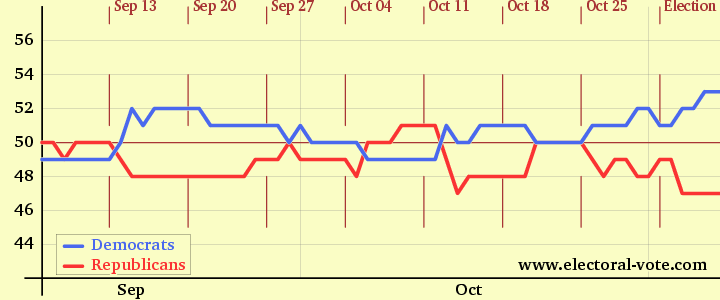
The graph above shows the current number of projected Senate seats since Sep 7, 2010.
The brown horizontal line shows the 50 seat mark.
The thin gray vertical lines show the boundaries between the months.
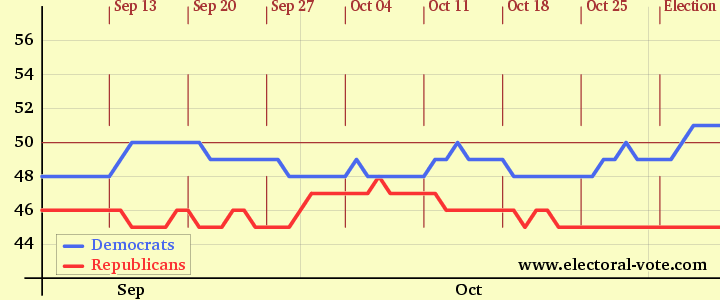
The graph above shows the Senate seats again but omits the "barely" states.
Only states where some candidate is ahead by 5% or more count here,
To see the poll graphs for all the states, go to www.electoral-vote.com/evp2010/Senate/Graphs
Back to the main page.