The Raw Polling Data
Many people have asked: "Which polls do you use?" To be as transparent as possible, all the raw polling data used is available for viewing and downloading as described below.
A different, but relevant question is: "Do you use every poll by every pollster?" The answer is no. By far, the vast majority of pollsters are consultants who are hired by candidates and parties to help them win elections. Many of them are quite good at keeping their eye on the ball--winning. To them, being honest is a tool to be used selectively, when it helps their overall goal. In general, these companies will release numbers when they make their candidate look good but if the numbers don't look good, they won't say anything. Furthermore, almost none of them publish their questions, methodology, or crosstabs making independent analysis impossible. None of their polls are used on this site. Nor are the polls from Research 2000 (which has been accused of making up the numbers). Only polls from neutral pollsters, who are generally hired by the media are used.
There are two borderline cases: Rasmussen Reports and Public Policy Polling. Rasmussen Reports is owned by Scott Rasmussen, who makes no bones about being a staunch Republican and who works for Fox News. He pioneered robopolling (automated calls made by a computer) and can thus run polls very quickly. While no one doubts that he actually runs the polls he says he does, the demographic models he uses to weight his data have been criticized as being skewed towards the Republicans. Public Policy Polling frequently works for left-of-center organizations like some unions but is not a campaign-strategy consultant-type company trying to win an election. It also uses robopolling. The two don't balance out because about 60% of all state polling is from Rasmussen and only about 10-15% is from Public Policy Polling. Still, no credible person has accused either one of cooking the books, so we will use both of them.
Viewing the Polling Data
If you just want to view nicely formatted and color-coded polling data (rather than downloading it for use in Excel or Open office), click on one of these links.
Downloading the Polling Data
The raw (unformatted) polling data is available for the Senate and House here:
- Senate polls in .csv format
- Senate polls as flat ASCII text
- House polls in .csv format
- House polls as flat ASCII text
Every poll occupies one line. The .csv files are formatted with the following comma-separated fields:
Day, Poll-length, State/CD, (empty), Dem-%, GOP-%, Ind-%, Ending-date, (7 empty fields), Pollster-poll-lengthThe flat ASCII text fields are:
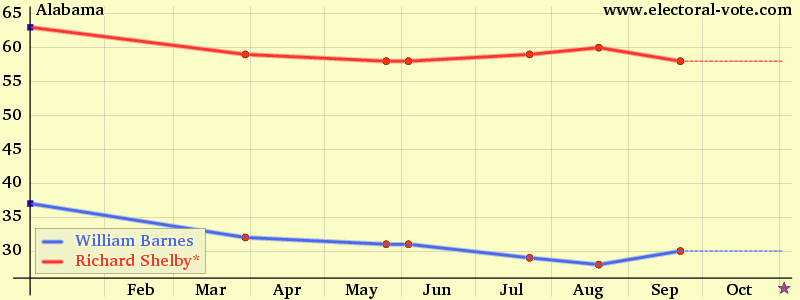
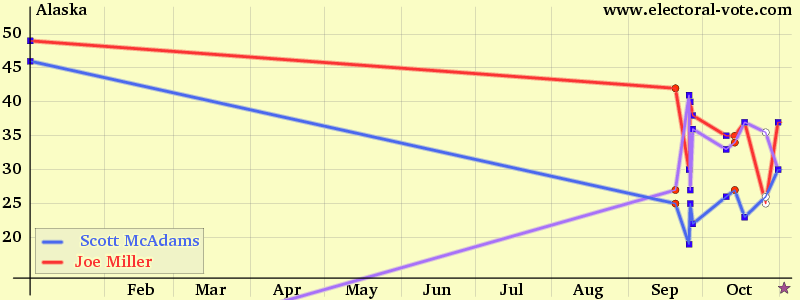
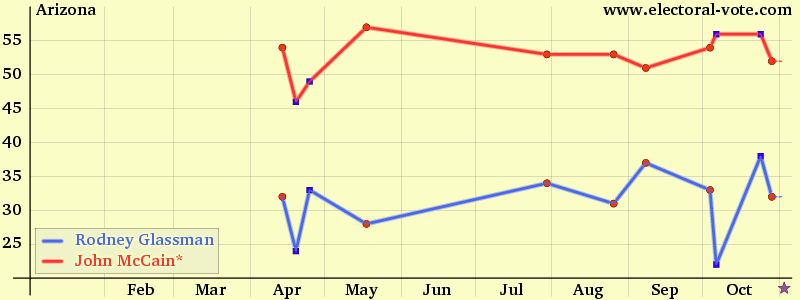
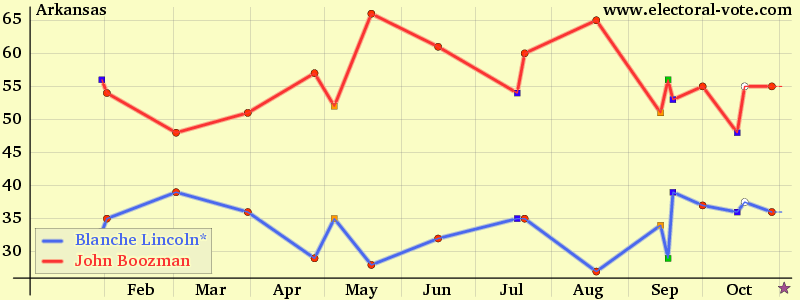
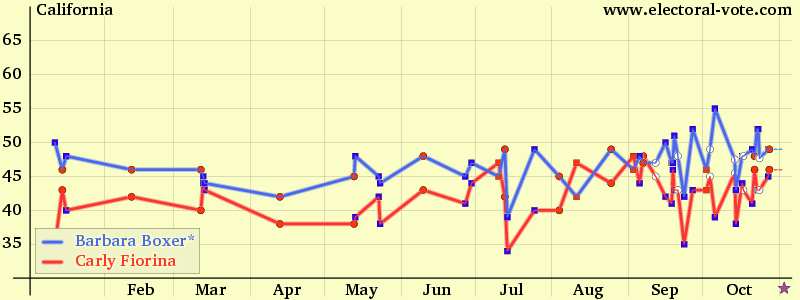
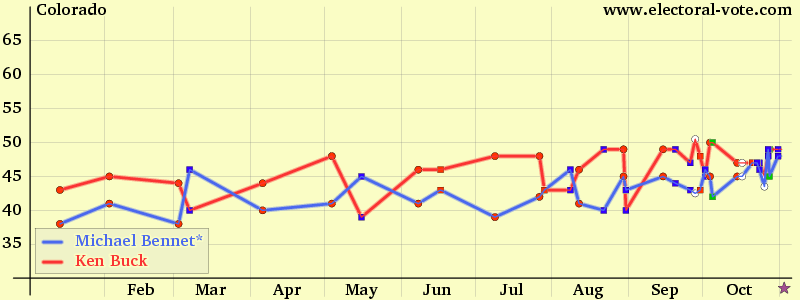
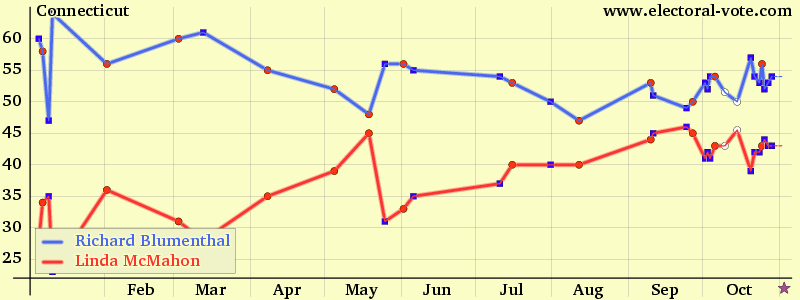
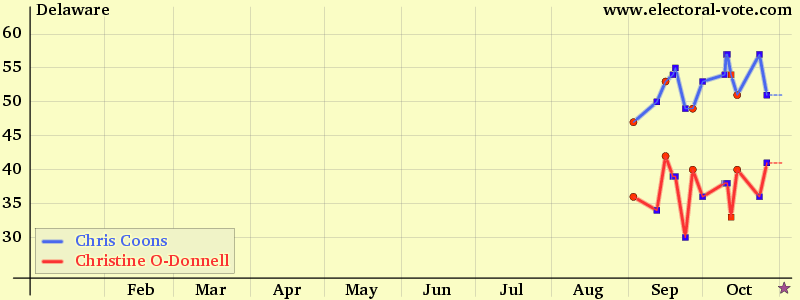
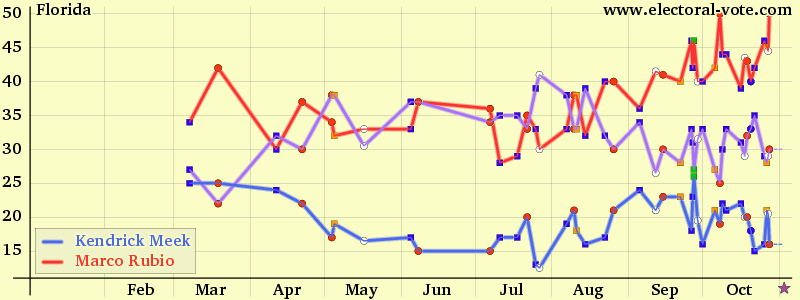
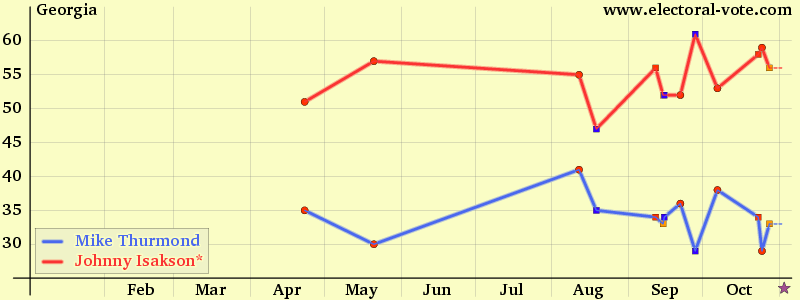
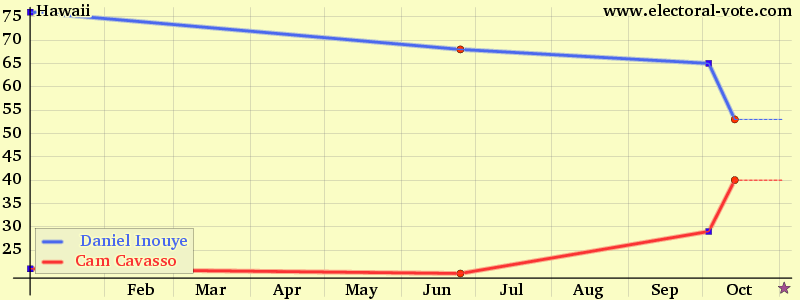
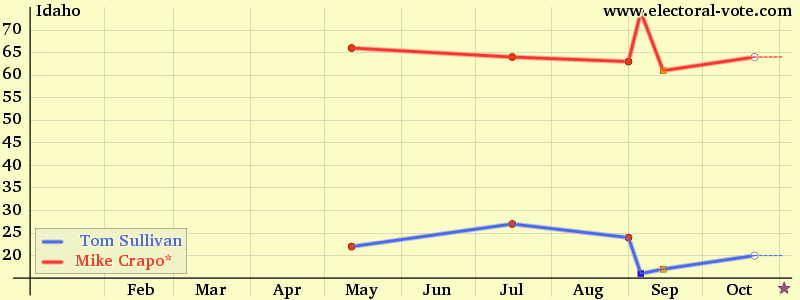
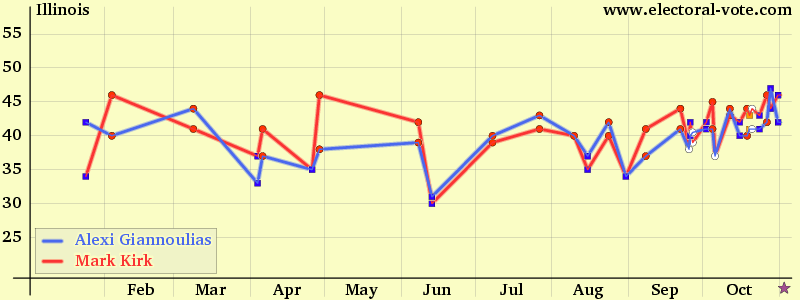
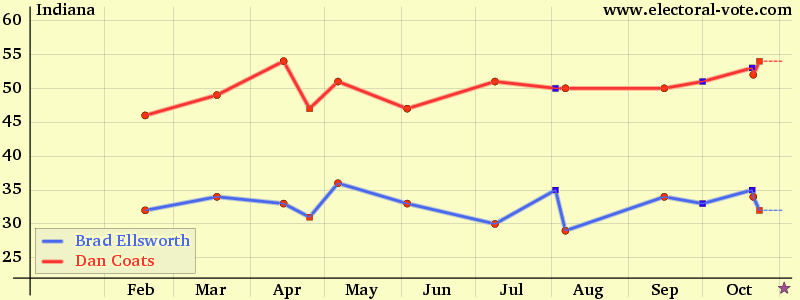
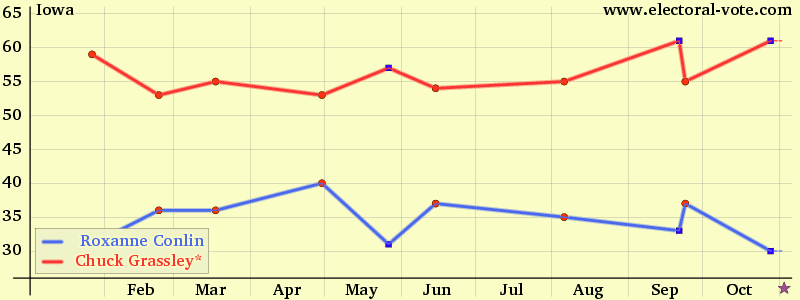
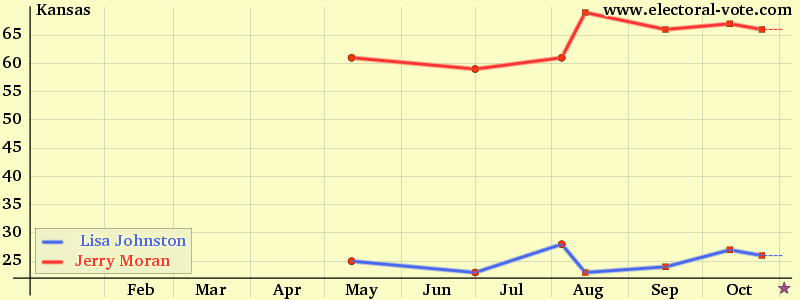
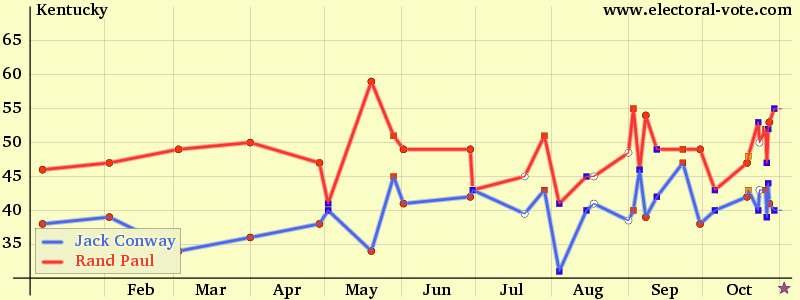
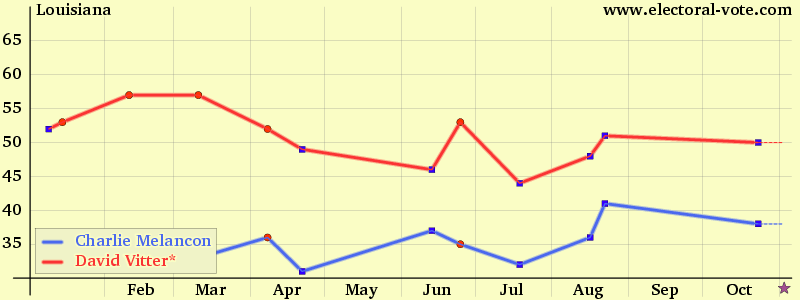
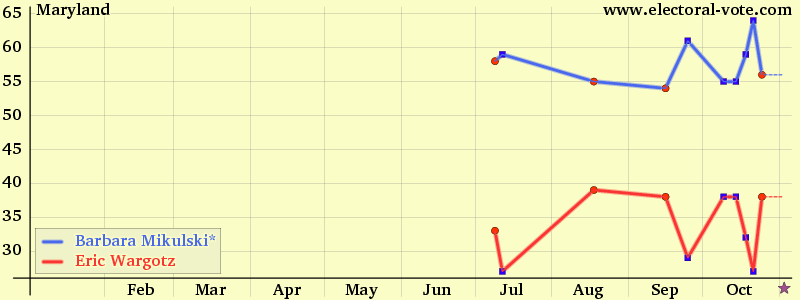
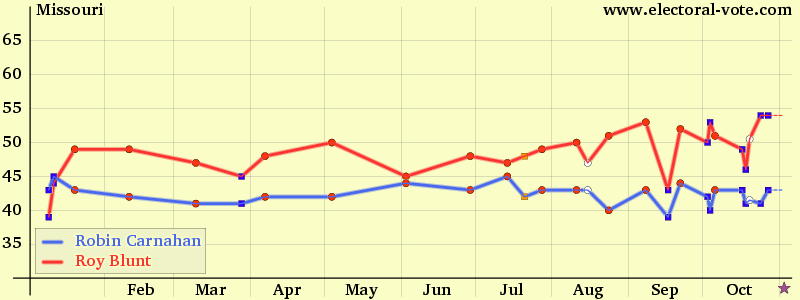
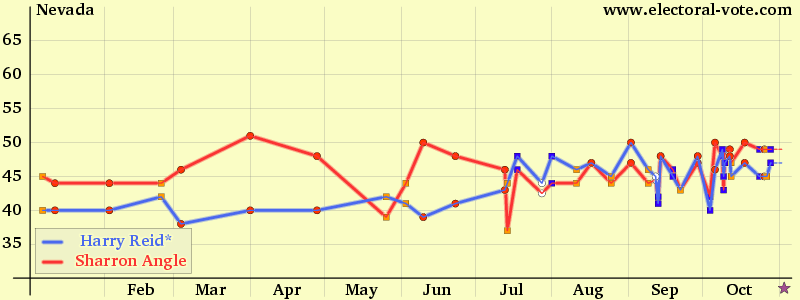
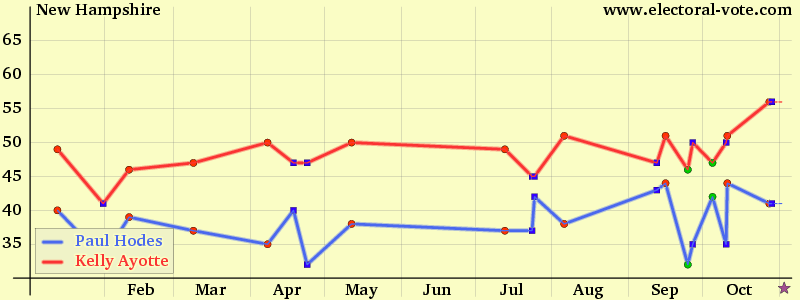
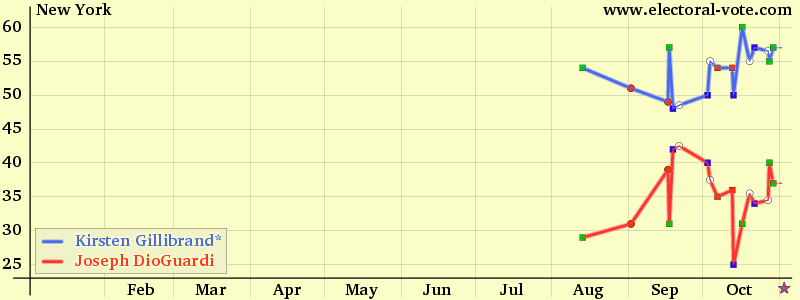
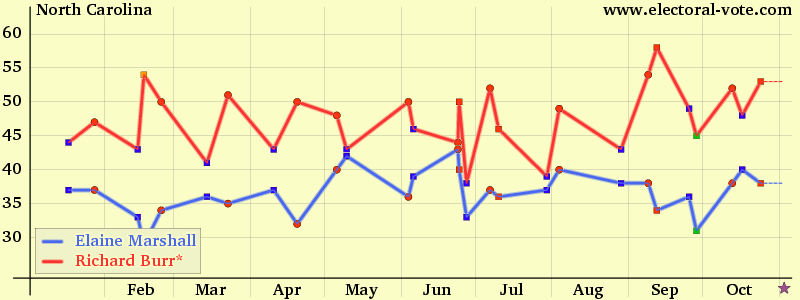
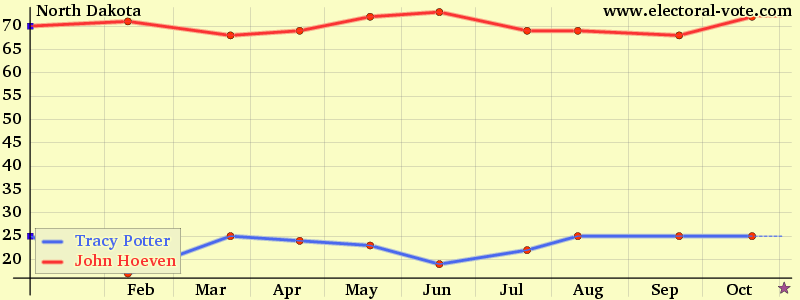
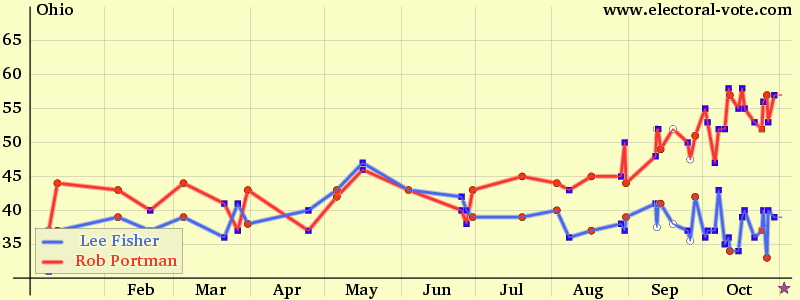
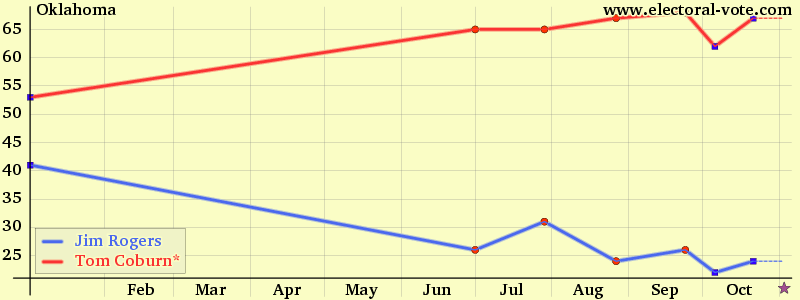
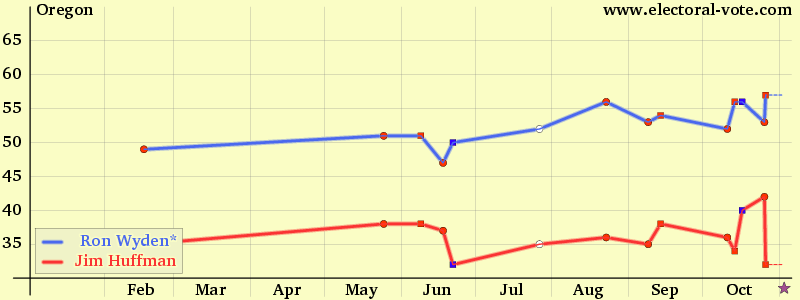
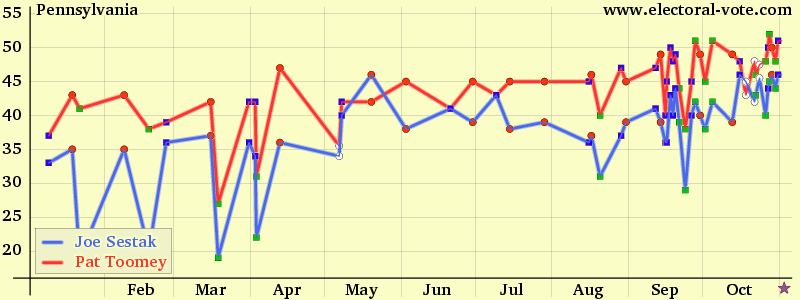
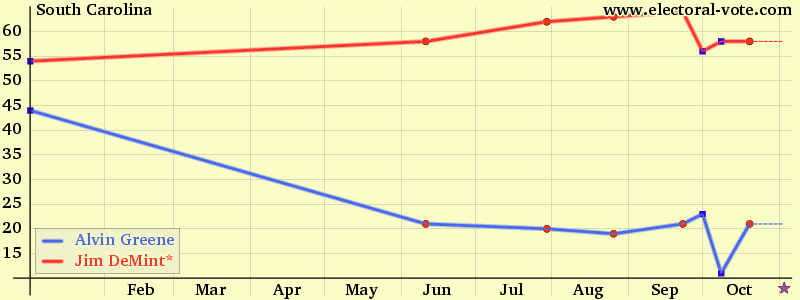
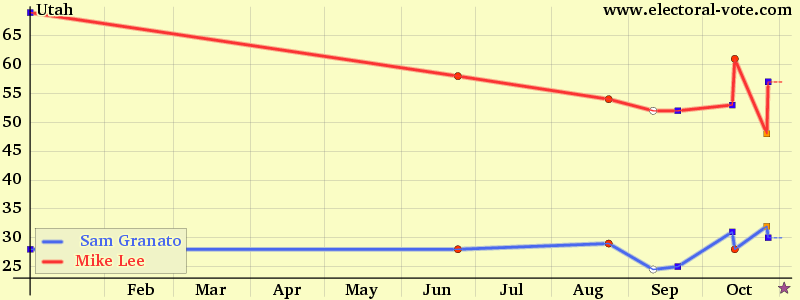
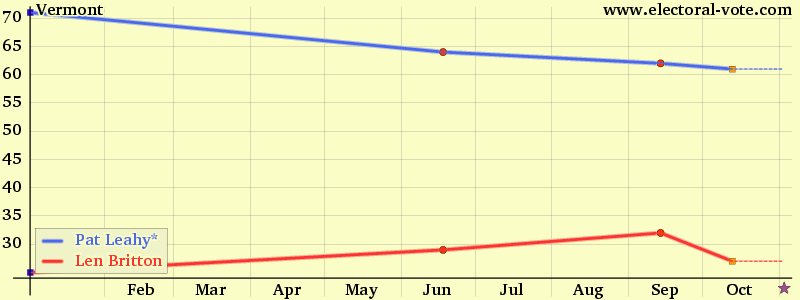
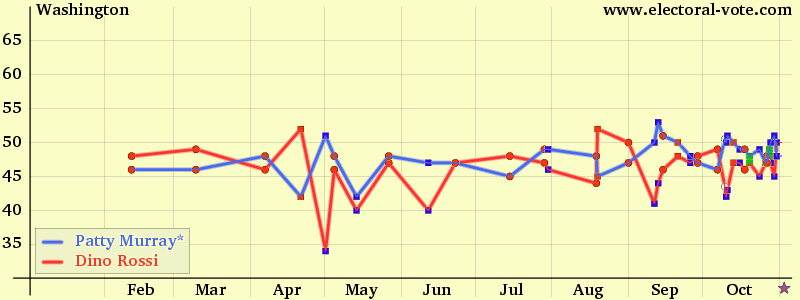
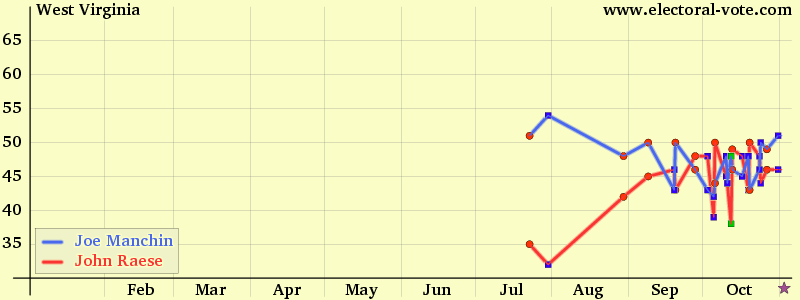
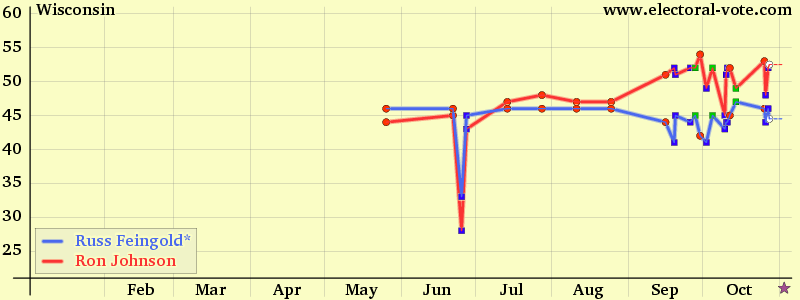
State/CD Dem % GOP % Ind % Starting-month Starting-day Ending-month Ending-day PollsterPolling Data in Graphical Form
If you prefer your data in graphical form, here it is.
Back to the main page.