Presidential polls: FL NC
Dem pickups: (None)
GOP pickups: IN NC
Previous | Next
Senate
Downloadable data
 Welcome
 FAQs
FAQs Electoral vote graphs
 Graphs of all polls
 Current score by state
 Icons for bloggers
 Data galore
 Donations
News from the Votemaster
New Features Added Today
There are two new features available starting today. First, there is a link called "This date in 2008" on the menu to the left of the map. Clicking on it goes back exactly 4 years, so you can see what the Obama-McCain race looked like then. All the links within the 2008 site, including "Previous report" and "Next report" work as expected, so you can check out other days in 2008, etc. Links to other sites may or may not work depending on whether the other site has kept its page. For readers who are new, all the links on the menu go to other pages on this site with lots of tables, charts, graphs, etc. about the election. Check them out.
Also new (really a bug fix), you can now get to the main page for the Senate races by clicking on the word "Senate" on the blue bar near the top of the page. It is present twice and both work now (one didn't in the past). The Senate page has its own map and information about all 33 Senate races below the Senate map, links to Senate polls, and more.
Where Do We Stand Compared to 2008?
One convention down and one to go, so where do we stand? There are many ways to look at it, one of which is a comparison with 2008. The table below compares the 2008 presidential race with this year's race. The first two numerical columns give the (averaged) polls for Barack Obama and John McCain on Sept. 3, 2008. The next one gives Obama's lead, with negative meaning McCain was leading. (The triangle in the heading is a capital Greek Delta, which is used in mathematics and science to mean "difference.") The next three numerical columns are the same thing for 2012. The final column is the difference between Obama's lead in 2012 and in 2008. Likely swing states are in purple.
| State | D 2008 | R 2008 | Δ | D 2012 | R 2012 | Δ | '12 - '08; | ||
| New York | 47% | 39% | 8% | 62% | 33% | 29% | 21% | ||
| Alaska | 39% | 44% | -5% | 38% | 62% | -24% | -19% | ||
| Tennessee | 32% | 56% | -24% | 40% | 47% | -7% | 17% | ||
| Delaware | 50% | 41% | 9% | 62% | 37% | 25% | 16% | ||
| Montana | 44% | 45% | -1% | 38% | 55% | -17% | -16% | ||
| Hawaii | 61% | 31% | 30% | 72% | 27% | 45% | 15% | ||
| North Dakota | 42% | 45% | -3% | 36% | 51% | -15% | -12% | ||
| California | 50% | 38% | 12% | 56% | 33% | 23% | 11% | ||
| Illinois | 53% | 38% | 15% | 55% | 29% | 26% | 11% | ||
| Indiana | 43% | 48% | -5% | 35% | 51% | -16% | -11% | ||
| Maryland | 53% | 41% | 12% | 58% | 35% | 23% | 11% | ||
| Texas | 41% | 50% | -9% | 35% | 55% | -20% | -11% | ||
| Arkansas | 37% | 47% | -10% | 39% | 59% | -20% | -10% | ||
| Kansas | 35% | 58% | -23% | 42% | 57% | -15% | 8% | ||
| South Carolina | 40% | 53% | -13% | 40% | 46% | -6% | 7% | ||
| Washington | 52% | 42% | 10% | 54% | 37% | 17% | 7% | ||
| Connecticut | 51% | 36% | 15% | 52% | 43% | 9% | -6% | ||
| West Virginia | 37% | 45% | -8% | 38% | 52% | -14% | -6% | ||
| New Jersey | 50% | 41% | 9% | 51% | 37% | 14% | 5% | ||
| New Mexico | 50% | 41% | 9% | 52% | 38% | 14% | 5% | ||
| Wyoming | 25% | 62% | -37% | 33% | 65% | -32% | 5% | ||
| D.C. | 90% | 9% | 81% | 92% | 7% | 85% | 4% | ||
| Iowa | 48% | 42% | 6% | 47% | 45% | 2% | -4% | ||
| Massachusetts | 49% | 37% | 12% | 55% | 39% | 16% | 4% | ||
| Michigan | 45% | 40% | 5% | 48% | 47% | 1% | -4% | ||
| Nebraska | 32% | 50% | -18% | 39% | 53% | -14% | 4% | ||
| New Hampshire | 45% | 44% | 1% | 50% | 45% | 5% | 4% | ||
| Pennsylvania | 47% | 42% | 5% | 50% | 41% | 9% | 4% | ||
| Rhode Island | 51% | 30% | 21% | 54% | 37% | 17% | -4% | ||
| Wisconsin | 46% | 41% | 5% | 48% | 47% | 1% | -4% | ||
| Alabama | 36% | 51% | -15% | 36% | 54% | -18% | -3% | ||
| Arizona | 36% | 44% | -8% | 41% | 52% | -11% | -3% | ||
| Idaho | 29% | 52% | -23% | 36% | 62% | -26% | -3% | ||
| Ohio | 42% | 43% | -1% | 47% | 45% | 2% | 3% | ||
| Oklahoma | 24% | 56% | -32% | 29% | 58% | -29% | 3% | ||
| Utah | 23% | 62% | -39% | 26% | 68% | -42% | -3% | ||
| Vermont | 63% | 29% | 34% | 62% | 25% | 37% | 3% | ||
| Virginia | 45% | 45% | 0% | 49% | 46% | 3% | 3% | ||
| Florida | 45% | 46% | -1% | 48% | 47% | 1% | 2% | ||
| Georgia | 43% | 50% | -7% | 41% | 50% | -9% | -2% | ||
| Kentucky | 37% | 55% | -18% | 41% | 57% | -16% | 2% | ||
| Louisiana | 38% | 55% | -17% | 40% | 59% | -19% | -2% | ||
| Maine | 49% | 36% | 13% | 52% | 37% | 15% | 2% | ||
| South Dakota | 43% | 47% | -4% | 43% | 49% | -6% | -2% | ||
| Colorado | 45% | 43% | 2% | 49% | 46% | 3% | 1% | ||
| Minnesota | 47% | 42% | 5% | 46% | 40% | 6% | 1% | ||
| Missouri | 41% | 48% | -7% | 44% | 50% | -6% | 1% | ||
| North Carolina | 43% | 46% | -3% | 46% | 48% | -2% | 1% | ||
| Oregon | 48% | 41% | 7% | 50% | 42% | 8% | 1% | ||
| Mississippi | 41% | 54% | -13% | 43% | 56% | -13% | 0% | ||
| Nevada | 47% | 44% | 3% | 49% | 46% | 3% | 0% |
There are a lot of numbers here, so here is an example taken from near the bottom, so you don't have to scroll to see it. In Missouri, Obama was at 41% and McCain at 48% on Sept. 3, 2008, which is indicated by -7% in column 4 (red because McCain was leading). Ultimately, McCain carried the state by such a small margin (3000 votes) that it took 3 weeks to figure out who had won. Currently, Obama is at 44% and Romney is at 50%, giving Romney a 6-point lead. The final column shows that Obama is actually doing a tad better now (1 point) than he was on Sept. 3, 2008. For this reason, the last column is blue. Three lines above Missouri, we find South Dakota, where the last column is red, meaning Romney is outperforming McCain there. Thus when the last column is blue, Obama is doing better this year than in 2008. When it is red, he is doing worse.
Please note that none of the polls were taken on Sept. 2 in either year. For example, the second biggest gap is Alaska. The reason for that is that although Sarah Palin had been chosen by Sept. 3, 2008, Alaska hadn't been polled subsequent to her selection as of Sept. 3, 2008. The poll used for Alaska in 2008 was taken by Rasmussen on July 30, 2008.
Of the 10 states we have marked in purple as swing states, Obama is running ahead of his 2008 pace in seven of them, is running behind in two of them (Wisconsin and Iowa) and is tied in one (Nevada).
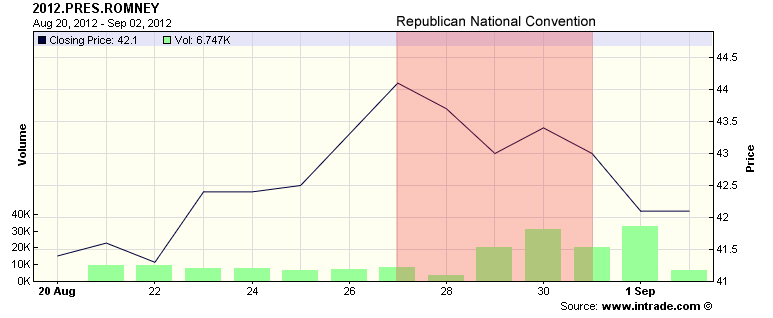
Romney Does Not Get a Bump on Intrade
Normally candidates get a bump after their conventions, but as measured by the betting Website www.intrade.com Romney did not get a bump. Before the Republication convention, shares were selling at $44 (meaning bettors thought there was a 44% chance of his being elected). Now his chances are 42%, indicating a net loss for the convention period. Obama's shares have risen correspondingly. Here is Romney's chart for the past two weeks.
No Bump for Romney in Florida Either
A new PPP poll in Florida, where the Republican National Convention was held, shows Obama ahead of Romney 48% to 47%, the same as it was five weeks ago. Thus it appears Romney did not get a bounce either locally or nationally. The Democrats chose North Carolina as the site for their convention in the hopes of getting a bounce there. In a week we will know if they did any better than the Republicans, who were certainly hoping for a bounce in Florida and didn't get it.
Opportunities and Dangers for Charlotte
The Democratic National Convention begins tomorrow in Charlotte. This is President Obama's chance to pull ahead of Mitt Romney, who didn't get much of a bounce from his convention. If Obama plays his cards right, he could get a bounce, but he has to do it right. But the convention is also fraught with danger. Here are some of the things to watch for.
Things Obama Needs to do- Attack Romney by showing that Romney is a threat to women, minorities, immigrants, and the poor
- Reassure people that the economy is getting better, slowly but surely
- Avoid having Clint Eastwood speak and generally avoid mistakes like that
- Fire up the base to get them to vote despite some disappointments
- Recapture at least some of the hope of 2008 for a better future
Things Obama Has to Worry About
- Bill Clinton causing damage rather than helping
- Elizabeth Warren veering too far to the left to help her own race but hurt Obama's
- Too much class warfare or protests on the streets
- Not filling up all the seats at the stadium where Obama is giving his acceptance speech
- Logistical problems in Charlotte such as not enough hotel rooms or rain during Obama's speech
Many Voter ID and Early Voting Cases in the Courts
In Pennsylvania, a judge ruled that there is nothing wrong with Pennsylvania's voter ID law. In Ohio, a judge made the state let everyone vote the weekend before the election, not just military families. However, these are only the tip of the iceberg. There are unresolved cases all over the country, including Wisconsin, Florida, Iowa, and Nevada. The cases involve voter ID laws, early voting, and purging the rolls of voters who, in fact, are eligible voters. In most cases it is the Democrats suing to overturn or stop Republican actions. In Nevada, however, the Republicans are suing over the state's unusual ballot option: "None of the above." A judge recently said it was unconstitutional. The battles are greater, more intense, and earlier than in any previous election.
Latinos Gain Importance in North Carolina
In 2008, Obama won North Carolina by a scant 14,000 votes. Since then. Latino voter registration has grown by 40,000. While most of these voters are conservative, religious voters by nature who ought to be voting Republican, the Republican party's barely disguised dislike for immigrants (e.g., the platform calls for making English the national language), is probably going to deliver most of these new voters to Obama. Obama is expected to get at least 70% of the Latino vote, maybe more, and in a close election, they could put him over the top. Even worse for the Republicans in North Carolina is the future. About 90% of the Latinos under 18 are U.S. citizens and more of them will be voting every year.
North Carolina and Virginia used to be Republican bulwarks but both have become swing states as a result of changing demographics. In Virginia, the growth of counties adjacent to D.C. has made the state more Democratic. In North Carolina, many northerners have been attracted to the state due to the large number of high tech and financial companies in Research Triangle Park. If the Democrats manage to turn both states into warmer versions of Maryland, Republicans will have tough times winning national elections in the future.
Democrats to Focus on 2012 but also 2016
While the primary focus of the Democratic National Convention opening tomorrow in Charlotte, NC is the 2012 election, some of the speakers are thinking ahead to 2016. No matter what happens in November, there will be no incumbent Democrat in 2016, so potential contenders are gearing up already. These include Vice President Joe Biden, who will be 73 four years from now, but also much younger politicians, including Gov. Martin O'Malley (D-MD) and Gov. Andrew Cuomo (D-NY). O'Malley likes the limelight, but Cuomo tends to shun it, just as his father, former New York governor Mario Cuomo, did. The elder Cuomo had a bit of a Hamlet problem, completely unable to make up his mind whether to run for President or not. Unfortunately for him, not demonstrating interest in the job is not seen as a plus. The younger Cuomo acted like he wasn't interested in being governor until he announced for it, then ran hard and won. These two governors plus Biden are probably the leading contenders for 2016 at the moment, but four years is forever in politics.
Today's Presidential Polls
| State | Obama | Romney | Start | End | Pollster | |
| Florida | 48% | 47% | Aug 31 | Sep 02 | PPP | |
| North Carolina | 43% | 47% | Aug 25 | Aug 30 | Elon U. | |
| North Carolina | 48% | 48% | Aug 31 | Sep 02 | PPP |