
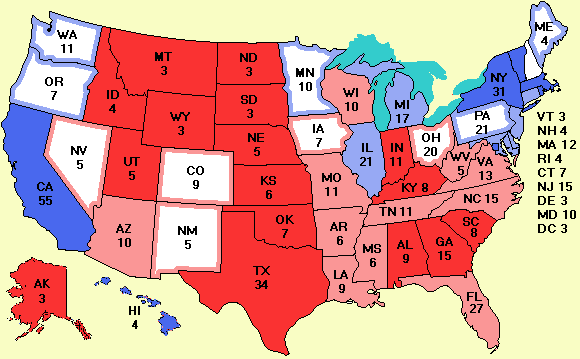
Electoral Vote Predictor 2004: Kerry 238 Bush 296
|
|


| Oct. 4 | New polls: AK AL OH SC |
 |
 Welcome
 FAQ
FAQ Donations
 Electoral college
 Electoral college graph
 Political humor
 Political websites
 Articles and books
 Kerry and Bush records
 Americans abroad
 Foreign nationals
 About RSS feeds
  Enhancements
 News from the Votemaster
This is one of those rare midday updates. Many people complained about the 30-day lookback period for averaging, so I changed it to 7 days. More tomorrow on that.
If you didn't visit the site yesterday, you might want to check out the story about the Senate races.
Today the site undergoes its first major change in methodology since its inception. Up until now, the only poll listed in the spreadsheet and the map was the most recent one. Early in the campaign, when polls were months apart, this approach made sense since a June poll was probably a better indicator than the average of the June, April, and February polls. Now with polls coming fast and furious, and the map changing wildly from day to day, I think it makes more sense to average the latest three polls. Why three? Ask your local anthropologist. Three is a magic number in western culture (three bears, three wishes, three chances, etc.)
If you want the actual formula for how the three polls are selected or want to construct the old-style spreadsheets yourself, see the Key, which is clickable to the right of the map.
Also new today, is a single .csv file with all the polling data since the beginning of Sept. This is the master file that drives the creation of the entire site. It can also be downloaded by clicking on Polling data to the right of the map. It will be updated daily. The Key page also explains what its fields mean.
As a result of switching to this averaging system, there is a dicontinuity between yesterday and today. Polls that were not the most recent one suddenly are factored in, so some states have changed since yesterday. This effect will not occur in the future (unless the averaging formula is changed).
The software that produces the dozens of HTML pages, charts, tables, graphs, maps and whatnot on this site every day is very complicated. It is all custom software--no commercial package could even come close to doing all this. There were some errors yesterday with the projected map which many people saw. I am working on it. The problem is that the averaging software interacts with the projection software in unexpected ways.
Newsweek has a new poll out showing Kerry ahead nationally 49% to 46% among REGISTERED VOTERS. Maybe they have caught on to the fact that the LIKELY VOTER screens aren't very good. But just as I didn't believe them when they had Bush more than 10% ahead, I don't believe them now either. It takes a while for the debate to sink in.
The numbers in the polls never add up to 100% due to two factors: minor candidates and undecided voters. The people who are for Badnarik or Peroutka now will probably vote for them, but historically, not many people who tell the pollsters "Undecided" actually cast a write-in vote for "Undecided." They usually decide. To get some background information about predicting elections involving an incumbent, check out this article.
Projected Senate: 51 Democrats, 48 Republicans, 1 independent
To bookmark this page, type CTRL-D (Apple-D on Macintoshes). If you are visiting for the first time, welcome. This site has far more about the election than just the map. See the Welcome page for more details.

|
|
