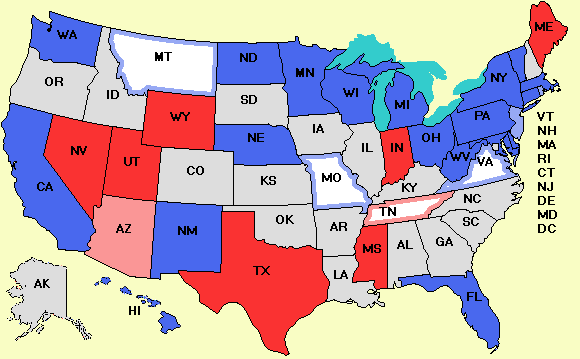
New Senate: 51 Democrats 49 Republicans
|
|
| Oct. 12 | Pickups: | Missouri, Montana, Ohio, Pennsylvania, Rhode Island, Virginia | |
News from the Votemaster
Let's take a look at how the pollsters did. Below is a table given the final vote in column 2, followed by the results of 8 pollsters. Each cell consists of the Democratic percentage minus the Repubican percentage. For example, in Arizona, the Democrat - Republican value is -9, meaning the Republican won by 9%. In California, the last poll from Mason-Dixon predicted a Democratic win by 30% (it was actually only 24%).
| State | Vote | Gallup | M-D | Polimetrix | Quinnipiac | Rasmussen | Research 2000 | SurveyUSA | Zogby |
| Arizona | -9 | -8 | -4 | -9 | -13 | -8 | |||
| California | 24 | 30 | 32 | 23 | 29 | ||||
| Connecticut | -10 | -4 | -12 | -8 | -12 | -11 | -12 | ||
| Delaware | 41 | ||||||||
| Florida | 22 | 24 | 26 | 35 | 17 | 18 | 23 | 29 | |
| Hawaii | 24 | ||||||||
| Indiana | -87 | ||||||||
| Maine | -53 | -46 | |||||||
| Maryland | 10 | 15 | 3 | 6 | 5 | 3 | 5 | ||
| Massachusetts | 38 | 40 | 30 | ||||||
| Michigan | 16 | 16 | 15 | 16 | 11 | 10 | 7 | ||
| Minnesota | 20 | 10 | 10 | 18 | 14 | 16 | 8 | ||
| Mississippi | -29 | -37 | |||||||
| Missouri | 3 | 4 | 1 | 0 | -1 | 0 | 6 | 3 | |
| Montana | 1 | 9 | 0 | 2 | 1 | ||||
| Nebraska | 28 | 20 | |||||||
| Nevada | -14 | -17 | -11 | -12 | -14 | -21 | |||
| New Jersey | 8 | 10 | 7 | 6 | 5 | 5 | 6 | 12 | |
| New Mexico | 42 | 24 | 20 | ||||||
| New York | 36 | 35 | 30 | 24 | |||||
| North Dakota | 40 | 22 | |||||||
| Ohio | 12 | 2 | 6 | 18 | 12 | 12 | 12 | 7 | |
| Pennsylvania | 18 | 18 | 13 | 16 | 10 | 13 | 8 | ||
| Rhode Island | 6 | 3 | -1 | 8 | 14 | ||||
| Tennessee | -3 | -3 | -12 | -5 | -4 | -5 | -10 | ||
| Texas | -26 | -36 | -26 | -19 | |||||
| Utah | -31 | -30 | -32 | ||||||
| Vermont | 33 | 32 | 21 | ||||||
| Virginia | 0.2 | -3 | 1 | 0 | 0 | 8 | 1 | ||
| Washington | 17 | 16 | 14 | 11 | 8 | 4 | |||
| West Virginia | 30 | 34 | 33 | ||||||
| Wisconsin | 37 | 45 | 27 | 9 | |||||
| Wyoming | -40 | -41 | -27 |
To see how well a pollster did, we can subtract the actual difference between the candidates from the predicted on. For example, in the table below, if we subtract Mason-Dixon's prediction for Arizona (-8) the actual vote total (-9) we get 1. In other words, Mason-Dixon predicted that the Democrat would do 1% better than he actually did. A perfect pollster would have a column consisting entirely of 0s. Since the margin of error in predicting each candidate's score is about 4%, the margin of error in predicting the difference is about 8%. Thus to a first approximation, any number less than or equal to 8 should be considered a correct prediction. Anything more than 8 is wrong.
| State | Gallup | M-D | Polimetrix | Quinnipiac | Rasmussen | Research 2000 | SurveyUSA | Zogby |
| Arizona | 1 | 5 | 0 | -4 | 1 | |||
| California | 6 | 8 | -1 | 5 | ||||
| Connecticut | 6 | -2 | 2 | 10 | -1 | -2 | ||
| Delaware | ||||||||
| Florida | 2 | 4 | 13 | -5 | -22 | 1 | 7 | |
| Hawaii | ||||||||
| Indiana | ||||||||
| Maine | 7 | |||||||
| Maryland | 5 | -7 | -4 | -5 | -7 | -5 | ||
| Massachusetts | 2 | -8 | ||||||
| Michigan | 0 | -1 | 0 | -16 | -6 | -9 | ||
| Minnesota | -10 | -10 | -2 | -6 | -4 | -12 | ||
| Mississippi | -8 | |||||||
| Missouri | 1 | -2 | -3 | -4 | 1 | 3 | 0 | |
| Montana | 8 | -1 | 1 | 0 | ||||
| Nebraska | -8 | |||||||
| Nevada | -3 | 3 | 2 | 14 | -7 | |||
| New Jersey | 2 | -1 | -2 | -3 | -3 | 2 | 4 | |
| New Mexico | -18 | -22 | ||||||
| New York | -1 | -6 | -12 | |||||
| North Dakota | -18 | |||||||
| Ohio | -10 | -6 | 6 | 0 | 0 | 0 | -5 | |
| Pennsylvania | 0 | -5 | -2 | -8 | -5 | -10 | ||
| Rhode Island | -3 | -7 | 2 | 8 | ||||
| Tennessee | 0 | -9 | -2 | -1 | -2 | -7 | ||
| Texas | -10 | 0 | 7 | |||||
| Utah | 1 | -1 | ||||||
| Vermont | -1 | -33 | ||||||
| Virginia | -3 | 0 | 0 | 0 | 7 | 0 | ||
| Washington | -1 | -3 | -6 | -9 | -13 | |||
| West Virginia | 4 | 3 | ||||||
| Wisconsin | 8 | -10 | -28 | |||||
| Wyoming | -1 | 13 |
I may not be able to get to the computer for a couple of days, but I will try to do this analysis for the House sooner or later.
Projected New House*: 230 Democrats 197 Republicans 8 Ties
See complete House polls.Dem pickups: AZ-05 AZ-08 CA-11 CO-07 CT-05 FL-16 FL-22 IA-01 IA-02 IN-02 IN-08 IN-09 KS-02 KY-03 MN-01 NC-11 NH-01 NH-02 NY-19 NY-20 NY-24 OH-18 PA-04 PA-07 PA-08 PA-10 TX-22 WI-08
GOP pickups:
If you like this site, please announce it to news groups and blogs and tell your friends about it. If you have your own blog, please click on "For bloggers" above.
-- The Votemaster