
Dem
51

GOP
49

Kyle Kondik, over at Larry Sabato's Crystall Ball, has a similar story to the previous one up now. His piece focuses on the county-level voting in Midwestern states. For example, he notes that in 2012, only six of Ohio's 88 counties gave Mitt Romney at least 70% of the vote. By 2020, 44 counties went for Trump by at least 70%. That is a similar point to the one Amy Walter made.
One thing that Kondik emphasizes is that half the counties does not mean half the votes. In Ohio, if you start with the least populous counties and work your way up, you would get to 79 counties to collect half the statewide vote. To put that another way, the nine most populous counties have as many votes as the other 79 combined. This got him thinking about other states in the Midwest. What does it look like if you start with the most populous county and keeping adding counties until you have half the vote? How many do you need and what does the map look like? Is it as skewed as Ohio? He called the small number of populous counties the "top half" and the large number of less populous counties the "bottom half." And keep in mind, the total vote of each half is roughly the same. The maps below show the top half counties in orange and the bottom half counties in gray.
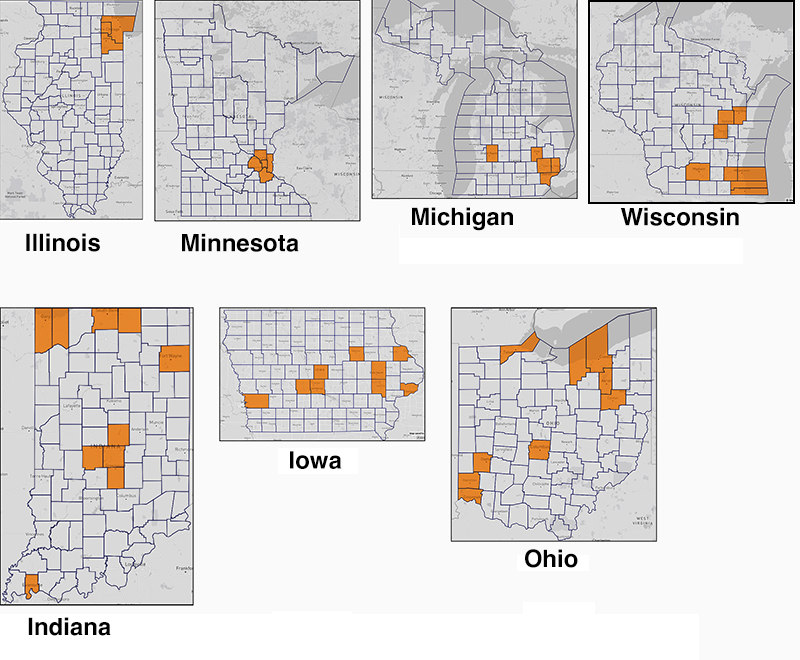
In Illinois, the top three counties have as many votes as the bottom 99. In Minnesota, the top five are equal to the bottom 82 in votes. In Michigan, the split is five to 78. The other states are somewhat less skewed, but not that much less.
Now let's look at how the vote went in the top half vs. bottom half, both in 2012 and 2020. Here are the data colored by the 2020 results. The numbers represent the Democratic minus Republican vote share for that year and "half." For example, in the three most populous counties in Illinois in 2012, Barack Obama beat Mitt Romney by 38 points. In the rest of the state, Obama lost by 5 points. In 2020, Joe Biden beat Donald Trump by 41 points in the three big counties but lost the rest of the state by 9 points.
| State | Top half | Bottom half | Top half | Bottom Half | |
| Illinois | 38% | -5% | 41% | -9% | |
| Minnesota | 18% | -4% | 30% | -17% | |
| Michigan | 20% | -2% | 16% | -10% | |
| Wisconsin | 15% | -2% | 17% | -15% | |
| Indiana | 1% | -21% | 3% | -34% | |
| Iowa | 15% | -3% | 12% | -28% | |
| Ohio | 18% | -13% | 16% | -32% | |
What is noticeable is that the top half sort of voted for the Democrat in 2020 by roughly the same margin in 2012 and 2020. However, the bottom half moved to the right in every Midwestern state, and sharply to the right in all but Illinois. This shows how concentrated the Democratic vote is. Each state has a few (urban and suburban) counties that are heavily Democratic with the rest of the state strongly Republican. These data basically reinforce what Amy Walter wrote, that the country is already heavily divided, not only among the states, but also among the counties within each state (at least in the Midwest, but we suspect in almost all states). (V)