
Dem
51

GOP
49

A new analysis shows that nine of the wealthiest congressional districts in the country are now represented by Democrats while Republicans represent most of the poorer half of the country. FDR is probably rolling over in his grave, but here we are. Below is a scatterplot of median income and how the district voted in the 2022 midterms.
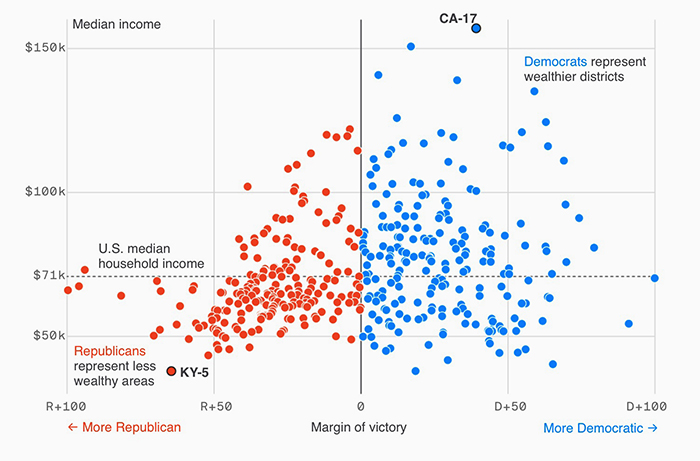
The way to read the scatterplot is as follows. To the right of thick vertical line, at Margin of victory = 0, are the districts Democrats won. More than half are above the $71K household income horizontal line. To the left of the Margin of victory = 0 line are the districts Republicans won. A clear majority are below the $71K line—that is, poor districts. So Democrats won rich districts and Republicans won poor districts. Republicans used to be the party of the country clubbers. That's really not true any more. The parties have swapped (many) voters.
But keep in mind that correlation is not causation. It may well be that Republicans' strength is in rural areas, and the people who live there are poorly educated and poor. So it may not be low income, per se, that drives people to vote Republican. It's probably other factors, like a lack of education, that are primary, but which correlate well with low income. Nevertheless, it is increasingly clear from many studies like this one that social class is a big determinant of how a district votes. Districts with many college-educated voters who are professionals have higher incomes than the average district and tend to be Democratic, with the reverse also true. (V)