
Dem
51

GOP
49

Here are the major polls taken since November of a Donald Trump vs. Ron DeSantis primary race. The ones with an asterisk show Trump's share of the Trump + DeSantis vote in a multiway poll.
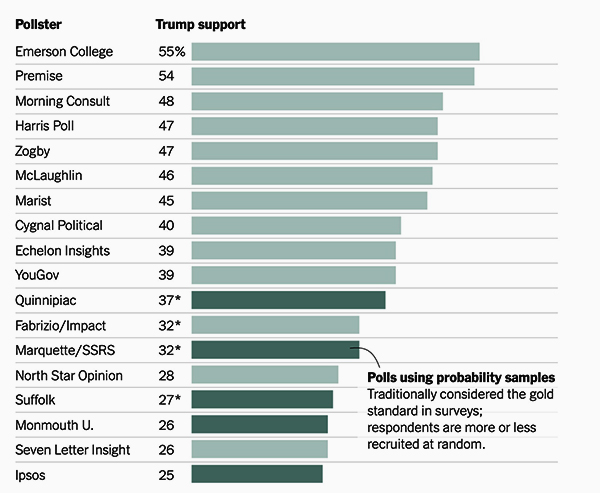
So we know in a Trump vs. DeSantis primary, Trump will get somewhere between 25% and 55% of the vote. Good to know.
So, what's going on here? The other Nate takes a stab at what the discrepancy is not:
If it is not all those things, what is it? Scores of 55±4 and 26±4 are not compatible. Not even close. And in FiveThirtyEight's pollster ratings, Emerson College gets an A- and Monmouth University gets an A, so it is not great pollsters vs. crummy pollsters. As we pointed out 2 weeks ago, early polls do matter, but how can we make sense of such a spread?
One difference between the polls is that some pollsters try to simulate random-digit dialing as best they can online. These are probability polls. They get very large lists of e-mail addresses from some organization that has very large lists and randomly pick a few thousand e-mail addresses and send them a message asking they want to participate in a political poll. Of course, the source of the list matters. Netflix would be a better source for a cross section of the Republican electorate than say, Christianity Today Magazine, but folks with the biggest and most useful lists might also be the least inclined to share them (unless enough money changed hands). Other pollsters place banner ads that say "Click here to take a poll" on websites. This mix depends hugely on where the ads are placed. Demographic normalization helps, but an ad on the NRA Website is going to get a different mix than on foxnews.com. If you look at the chart above, the probability pollsters exhibit less spread than the nonprobability pollsters, so maybe this is a clue. This suggests that Trump is well below 50%. Various other studies have shown that something like 30% of Republicans are Always Trumpers, so the chart is at least consistent with that. Most likely, different pollsters ended up with very different pools of potential respondents due to how the pools were assembled. And then there is the issue of the "shy" Trump voters. It is possible that depending on how the respondents are gathered, one gets more or fewer of them.
Another piece of data the other Nate looked at is Trump's share of the 2024 Trump vs. DeSantis polls compared to Trump's actual share of the 2016 primaries. In a number of states, he is running behind his 2016 actual share of the vote:
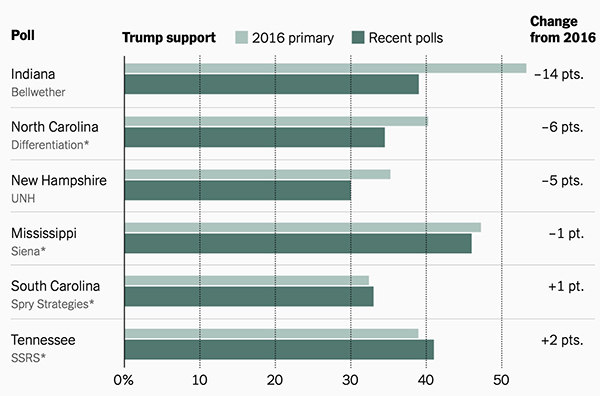
Again, this is early in the season, before DeSantis has even announced, and way before both candidates bring out the big guns and start throwing mud. What happens when Trump calls DeSantis a pedophile and DeSantis calls Trump the biggest loser in American history? The article's very tentative conclusion is that Trump's support is in the 30s, but that could change rapidly when the shooting starts as DeSantis has never been tested on the national stage and Trump has never faced an opponent as smart, focused, and eager to hit below the belt as DeSantis. (V)