
Dem
47

GOP
53

As we have pointed out many times, one of the most important factors in the midterms is how popular the president is. As readers know, the House is not one election, but 435 separate, independent elections. So to a considerable extent, what matters is not so much the president's average approval rating nationwide, but his approval rating in each of the 435 congressional districts.
Only a handful of districts have been polled and even then the question now is usually: "Do you prefer the Democrat or the Republican?" Later, names will be filled in in some competitive races. For now, G. Elliott Morris has tried to fill in the missing data using mathematical modeling. For every district, basic demographic information is known. So for every district, it is known how many people are white, how many are Black, how many are under 30 or over 65, how many are rural, suburban, or urban, how many make under $50K or over $100K, how many have 4-year college degrees, and a lot more. From national polling, attitudes toward the president are known for each of these categories.
Consequently, it is possible to run a kind of synthetic poll using advanced mathematical techniques. So, for example, if a district is packed with affluent white college-educated suburbanites averaging $200K, the model will show that Trump's approval is in the (not-so-golden) toilet. However, in a district consisting primarily of white high-school-only working-class men in a dying town in the Rust Belt, the model will show that Trump's approval is high. Morris did the math for every district. No one else has ever done this before, not even Nate Silver, even though the techniques are well understood. It is a lot of leg work chasing down all the data, inputting it, and writing the code to make the model run.
What Morris found is that in 104 congressional districts with a Republican incumbent (and also in 31 states with a Republican senator), Trump is underwater, with a net negative approval rating. That doesn't mean the district or state will necessarily go blue. There are voters who hate Trump bitterly, but hate the Democrats even more. Also, the actual candidates sometimes make a difference, especially if one is especially appealing or especially annoying. Money can also matter sometimes. Gas prices can matter.
Still, any Republican incumbent who hitches his or her wagon to Trump may be in for a rough ride. But if they unhitch it, Trump may bring the hammer down on them. Morris has made the results available here. Note that this link gives you only the first of three pages. Links to the other two are at the top of the page.
Below are the 20 districts where Trump is most deeply underwater (the fourth column). These are undoubtedly districts that Democrats will go after the hardest. The campaigns here will probably feature Trump's broken promises prominently, using campaign video of him promising to lower prices, promising no more wars in the Middle East, and other things he said, depending on the district. For example, in PA-07, which has many blue-collar workers, video footage of Trump promising to revive manufacturing jobs would be a good idea, whereas in AZ-06 (Tucson) that is less of an issue:
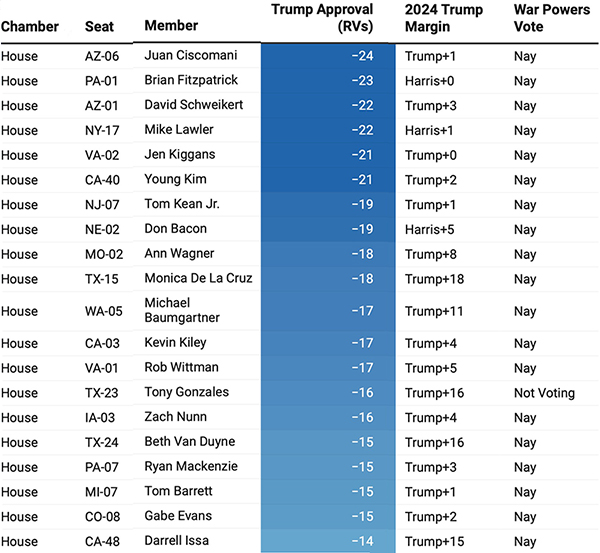
Figuring out where to spend money will be a challenge for the DCCC, but data like this are surely helpful. Of course, some judgment is needed to weigh the various factors. In NJ-07, Trump is -19 and he won the district by only 1 point in 2024. In contrast, in TX-15, Trump is -18 but he won the district by 18 points. So should the DCCC target NJ-07 (Tom Kean Jr.) more than TX-15 (Monica de la Cruz)? Maybe. NJ-07 is in the expensive New York Metropolitan media market and TX-15 is in the ultracheap Rio Grande Valley. It could also depend partly on the DCCC's estimate of how good a fit the challenger is to the district. (V)