
Dem
54

Ties
2
GOP
44

The scale of the Democrats' victory is still revealing itself. It is massive. Let's look at the macro aspects now. We will discuss individual winners and losers later this week. The AP has now called 254 House seats for the Democrats and 162 for the Republicans, with 19 still too close to call yet. The Democrats are likely to hit 260 seats.
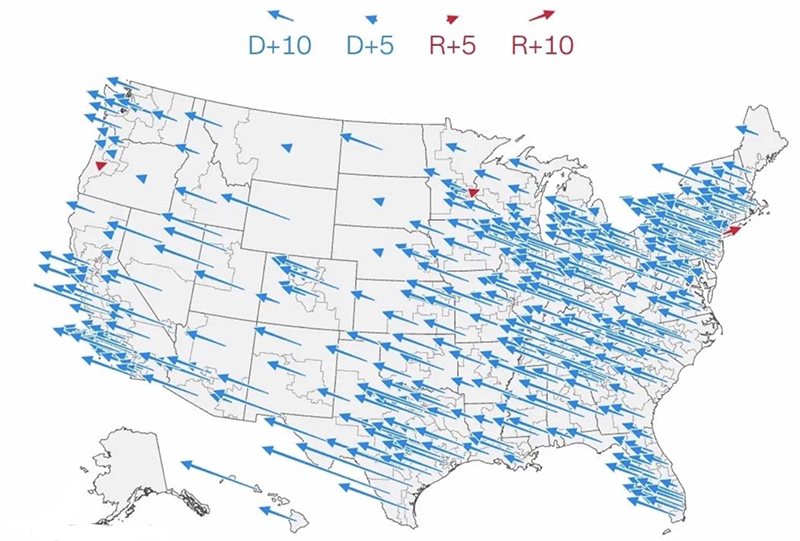
Here is a map showing the shift per House district since 2024. With only a handful of exceptions, every district in the country moved toward the Democrats. The scale of the Democrats victory is gigantic.
Here are the results of recent House elections. And while we are at it, the Senate ones as well. The percentages are of the popular vote. The difference between the parties' votes in the House this year is likely to be about D+13. The polls were predicting D+8 to D+11. Democratic turnout was unexpectedly high:
|
|
|||||||||||||||||||||||||||||||||||||||||||||||||||||||||||||||||||||||||||||||||||||||||||||||||||||||||||||||||||||||||||||||||||||||||||||||||||||||||||||||||
As you can see, the Democrats are going to have more seats in the House than either party has had in the past 25+ years. That is a huge win. If they get to 56 Senate seats (by winning Alaska and Mississippi) that will be more than either party has had other than what the Democrats had for the 2-year period 2009-2011. By recent historical standards these majorities are huge.
Now, what about governors? If Jonathan Kreiss-Tomkins (D) and Cindy Holscher (D) end up winning the elections in which they are currently leading—in Alaska and Kansas, respectively—the Democrats will have 30 governorships and the Republicans will have 20. How does that stack up in the context of the past quarter-century? Here are the data:
| | |||
| Year | Dems | GOP | Inds |
| 2026 | 30 | 20 | 0 |
| 2025 | 24 | 26 | 0 |
| 2024 | 23 | 27 | 0 |
| 2023 | 23 | 27 | 0 |
| 2022 | 24 | 26 | 0 |
| 2021 | 22 | 28 | 0 |
| 2020 | 24 | 26 | 0 |
| 2019 | 23 | 27 | 0 |
| 2018 | 23 | 27 | 0 |
| 2017 | 16 | 33 | 1 |
| 2016 | 16 | 33 | 1 |
| 2015 | 18 | 31 | 1 |
| 2014 | 18 | 31 | 1 |
| 2013 | 20 | 30 | 0 |
| 2012 | 20 | 30 | 0 |
| 2011 | 20 | 29 | 1 |
| 2010 | 26 | 24 | 0 |
| 2009 | 28 | 22 | 0 |
| 2008 | 28 | 22 | 0 |
| 2007 | 28 | 22 | 0 |
| 2006 | 22 | 28 | 0 |
| 2005 | 22 | 28 | 0 |
| 2004 | 22 | 28 | 0 |
| 2003 | 23 | 27 | 0 |
| 2002 | 22 | 27 | 1 |
| 2001 | 19 | 29 | 2 |
| 2000 | 18 | 30 | 2 |
Since 2000, the Democrats have never had more than 28 governorships, so this would be a 21st-century record for them. The Republicans had 30 in 2000 and a good run with 33 for 2 years after the election of Donald Trump in 2016. Then they lost 6 in 2018.
All in all, this is a high point for Democrats. They haven't had over 260 House seats in a quarter-century and in one election when they more senators than now (2008), they had fewer House seats and fewer governorships. Now it is up to them to do something with this new power. That is a subject we will begin to address in great depth tomorrow. (V)