
Dem
55

Ties
1
GOP
44

While we are picking over the elections some more, let's take another look at the polls. On the whole, they underestimated the Democrats this time, instead of the Republicans. The error was about 4 points, but the margin of error in state polls is generally about 4 points, so while the polls were off, they weren't really off by more than the margin of error. After all, due to the nature of random sampling, the measured value is going to be off from the true mean by more than the MoE 5% of the time (two sigma). That's just math. There is nothing anyone can do to fix that other than having a bigger sample, which costs more money.
Here is a graph showing the known historical polling errors in polls from 1998 to 2024 and the average of all the quality polls in the 3 weeks before Election Day this year:
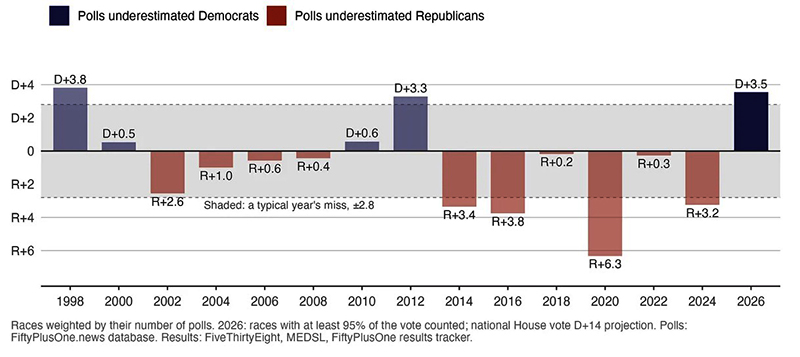
Note that by averaging polls over 3 weeks, the average is going to miss last-minute changes and so probably be worse than using only polls from the last week. On the other hand, using only polls from the last week would mean less data in the average, thus being more accurate but less precise.
Interestingly, the spread was huge. Democrats beat the polling average in 18 of the 22 races examined. Oddly enough, the pollsters did the worst in the states most closely watched. The polls underestimated Sen. Jon Ossoff (D-GA) by 10 points whereas they missed Adam Hamilton by only 1 point and overestimated the three independent Senate candidates by quite a bit. Here is the breakdown by candidate:
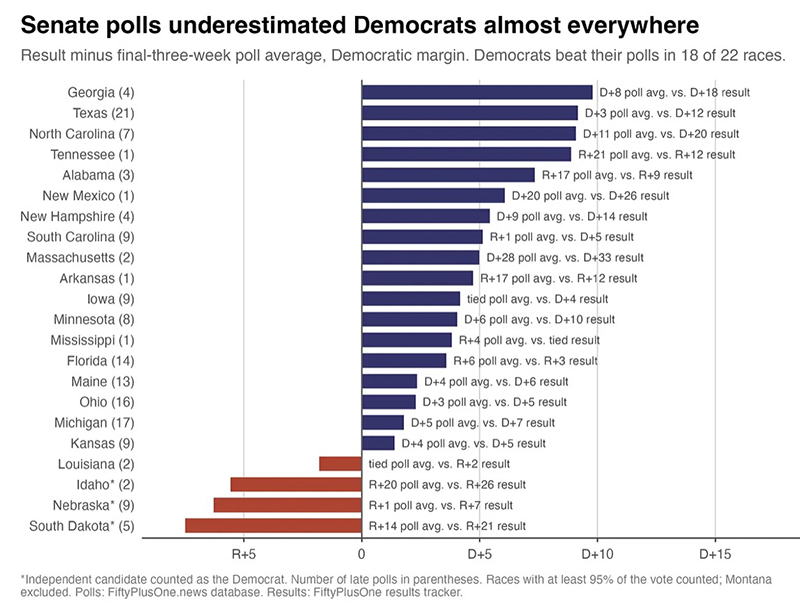
What went wrong? One can dig deeper and try to see if there were methodological errors that created the error, rather than unlucky samples. For one thing, there appeared to be a lot of movement toward the Democrats in the final week. If some organization had run a poll on Nov. 2, it might have been much better than a poll taken a week earlier. But no one did (because it couldn't be published until after Election Day, so what's the point?). Maybe there were "shy Democrats" who were embarrassed to say they were going to vote for Troy Jackson or Annie Andrews? Maybe something else?
G. Elliott Morris, who is competing to be the new Nate Silver, took a deep look at the data and came to some tentative conclusions. What did he find?
The generic House polls before the elections had the Democrats up by 9-11 points, depending on the poll. They won by 14 points. The polls did see and correctly predict a blue wave, but it was bigger than expected. Why did the polls miss this?
From examining the data in Morris' own Verasight polls and other high-quality polls, it appears that the demographics of the people sampled matches the population at large well. In other words, it wasn't that Democrats refused to answer the pollsters' calls or text messages out of fear of jinxing the results by making the election look like a done deal so Democrats wouldn't bother to vote. The number of Democrats who did the surveys was in line with the percentage of Democrats in the country.
So the problem was elsewhere. Was it the undecideds finally making up their minds? Maybe, but as Election Day approaches, almost all pollsters switch to a "likely voter" model rather than a "registered voter" model because it is well known that a substantial fraction of registered voters simply don't vote, even though they could. Each pollster has a secret sauce for trying to guess (and "guess" is definitely the operative word here) who is going to vote. One way is to ask the voter: "Are you going to vote?" Turns out that question isn't actually a good indicator because people are loathe to tell a pollster "Nah, voting isn't important and I have other stuff to do this week."
Some pollsters use other data where they can. In some states, lists of who actually voted in each election are available for sale. People can also be asked specifically: "Did you vote in 2024?" and "Did you vote in the 2022 midterms during the Biden administration?" Interestingly enough, people don't often lie about specific facts like that. So some pollsters use past voting behavior as a key element in their prediction of who will actually vote.
Morris' conclusion from studying the data is that while the sample had the correct number of Democrats in it, the guess about who would likely vote was off. He concluded that while people who voted for Kamala Harris turned out at the expected rate of 85%, Donald Trump voters turned out less than expected. This agrees with the above item about evangelicals. Lower Republican turnout than normal and expected was part of the problem. The pollsters expected Republicans to show up in their usual numbers and they didn't.
A second thing Morris learned from the data is that voters who did not vote in 2024 (in some cases because they were too young) skewed very heavily Democratic, something like 75% to 25%. Pollsters have to make a guess about what people without a voting history will do and they underestimated how many voters were so angry about the state of the country that they actually voted in a midterm (and again, some were too young to vote last time and were damn sure to make their first vote a good one). Infrequent voters also swung hard to the Democrats.
So Morris' conclusion is that the models for guessing who would vote were off. Young voters and marginal voters showed up in great numbers to vote for the Democrats, much more than anyone expected. Marginal voters are flaky and can shift radically from one election to another. Nonresponse bias wasn't a problem. His advice to pollsters going forward is this: First, when signs show that the out party is surging, weight the intention-to-vote question more heavily than usual. They really mean it this time. Second, forcing the presumed electorate (who is allowed to vote) to the 2024 model was fine. The problem was which of the eligible voters actually voted. Work on a better algorithm. Third, the pollsters could publish a range of results based on different turnout assumptions. In other words, if 70% of the 2024 voters vote, we get these results. But if 75% of the 2024 voters vote, we get these other results. And if by some miracle, 80% of the 2024 voters get up, we get these other results. This is another way to do stress testing. Political junkies would like this and understand it, but many people who hated math in school might be very confused by it. What's a pollster to do? (V)