
Dem
53

Ties
2
GOP
45

Nate Silver's FLIPR model updates every day as new data come in. The biggest single factor in the model is the generic House poll. That has been on a steady march in a Democratic direction since March, probably due to the war in Iran, gas prices, diesel prices, data centers, Donald Trump's approval rating, and more. Here is the daily generic House poll over time:
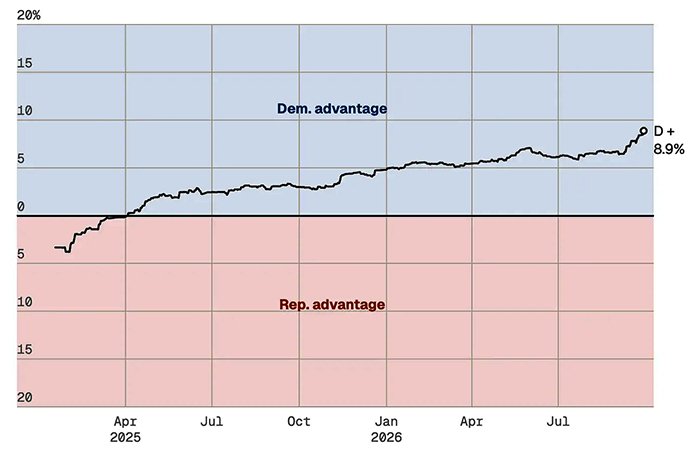
The current value is D+8.9. For the record, there are 87 Republican-held House districts between EVEN and R+8 (inclusive). This definitely does not mean that all of them will flip in November. Candidate quality, campaign quality, funding, local issues and more always play a role. Also, the vote distribution is important. Getting 65% of the vote in California doesn't win Ohio House seats. Still, if the popular vote for the House is close to 9 points in favor of the Democrats, many of these seats will be in play and there will be a strong blue wave—if nothing changes between now and Nov. 3.
Also in this vein, Larry Sabato's Crystal Ball yesterday shifted 11 more House races toward the Democrats. Most noteworthy are PA-07 (Ryan Mackenzie, R) and VA-02 (Jen Kiggans, R), which now lean toward the Democratic challenger. Also, in VA-01, Rep. Rob Wittman (R-VA) is now in a tossup race instead of one that favors him.
Now on to the Senate. Silver's model had the Senate at 50-50 as of Labor Day, but has since moved in favor of the Democrats. Look:
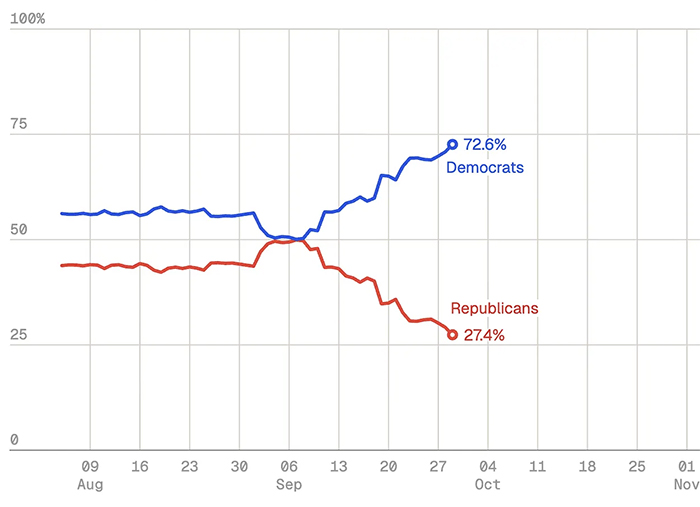
The Senate model is clearly reacting to the strong Democratic polling in Alaska, Iowa, Kansas, Maine, North Carolina, Ohio and Texas over the last month. Our (polling-based) model also has the Democrats taking the Senate, with one or two seats to spare, depending on whether Sen. John Fetterman (D?-PA) jumps ship.
Could Silver be way off? Sure, and 27% is better odds than getting "heads" twice in a row when flipping a coin. Also, the Decision Desk model has the chances of the Democrats taking the Senate at 54%.
Additionally, history shows that the "out" party generally (but not universally) does better than the president's party, with the number of Senate seats lost depending on how many the "in" party is defending. Here are the historical data:
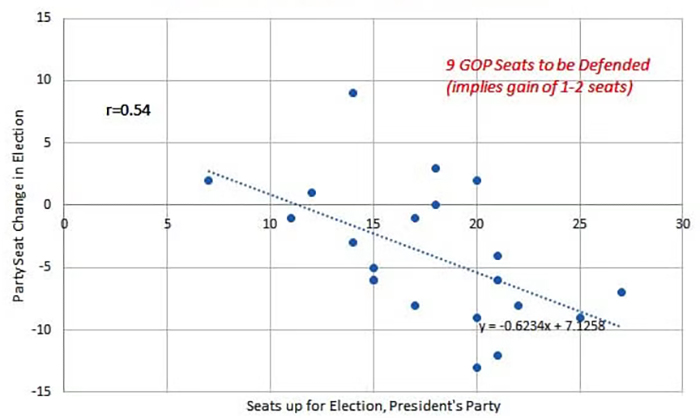
The correlation is looser here than for the House (where the president's party has lost seats in every midterm since World War II except 1998 and 2002). The Republicans are defending 22 Senate seats this cycle. From the regression line, that would project out to a loss of six seats for the Republicans. They have 53 now, so the historical norm would be for them to have 47 in January. We currently have them at 45 with two ties. But one of the ties is in Nebraska, which seems like a long shot to us. The other is Minnesota, which we expect Peggy Flanagan to win. That would put the Republicans at 46, close to the historical average loss. Still, in politics, a week is a long time and the election is over a month from today. (V)