
Dem
53

Ties
2
GOP
45

Some interesting demographic data is available about the early voters in North Carolina. For example, so far 405,000 Democrats, 317,000 independents and 201,000 Republicans have voted. 496,000 women, 393,000 men, and 45,000 undesignateds (their term) have voted. About 67% of the early voters are white and 23% are Black. The rest are Asian, Native American, mixed or unspecified. The overwhelming majority of the early votes (95%) were in person. But the graph that we found most interesting was the age distribution, shown below:
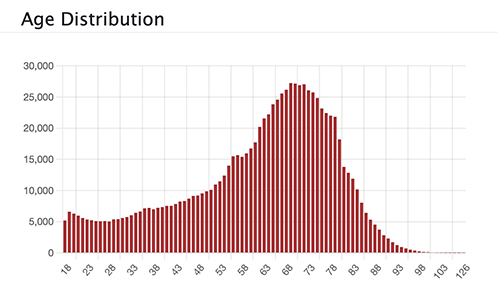
The top ages are 69-73. We find this a bit surprising. Yes, these seniors are probably retired and have time to vote (in person) early. Are the younger voters, who have less free time, all going to vote on Election Day, with its long lines? Maybe they will vote by mail, although given the early voting statistics, few have done so already. Thanks to reader H.W. in Wake County, NC for the heads-up. (V)