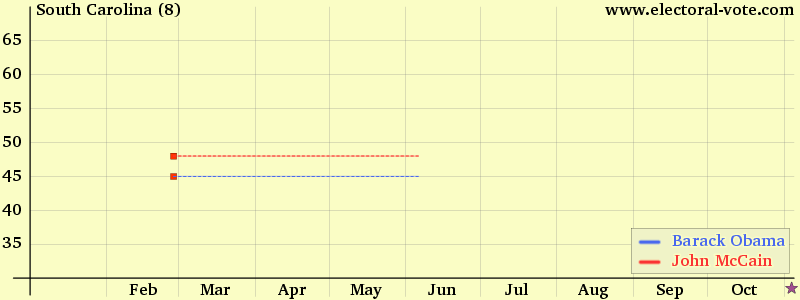
South Carolina Polls
 |
| |
The y axis is the percentage of the voters who said they would vote for the candidate.
Every point is plotted on the middle date of its poll.
For additional state polls, click on a state abbreviation:
AL
AK
AZ
AR
CA
CO
CT
DE
DC
FL
GA
HI
ID
IL
IN
IA
KS
KY
LA
ME
MD
MA
MI
MN
MS
MO
MT
NE
NV
NH
NJ
NM
NY
NC
ND
OH
OK
OR
PA
RI
SC
SD
TN
TX
UT
VT
VA
WA
WV
WI
WY