Pennsylvania Polls
 |
| |
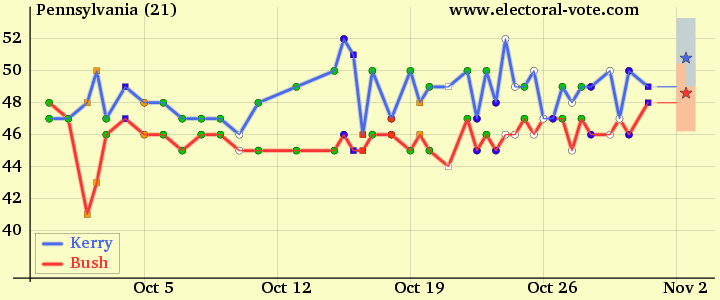
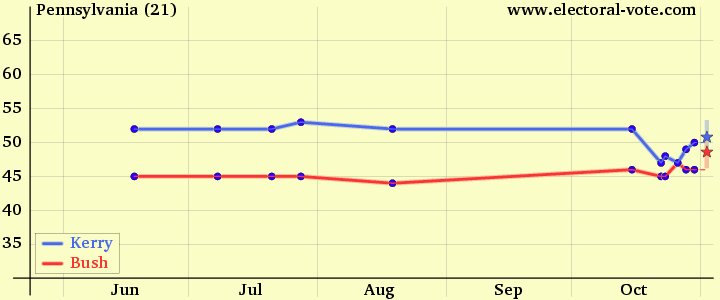
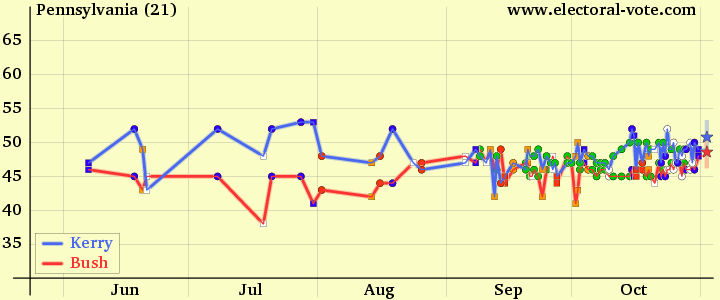
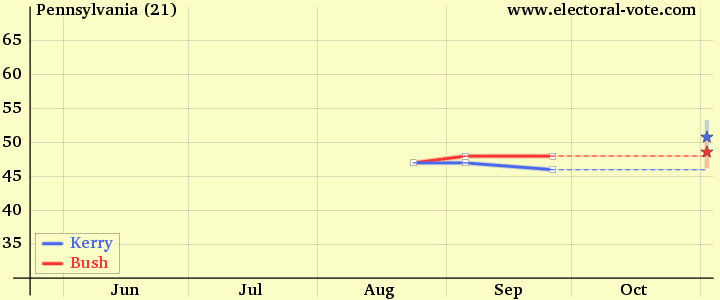
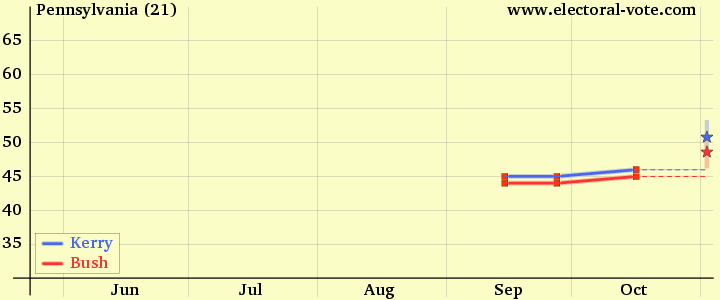
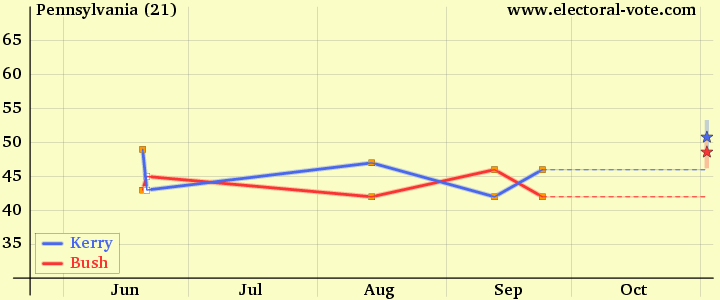
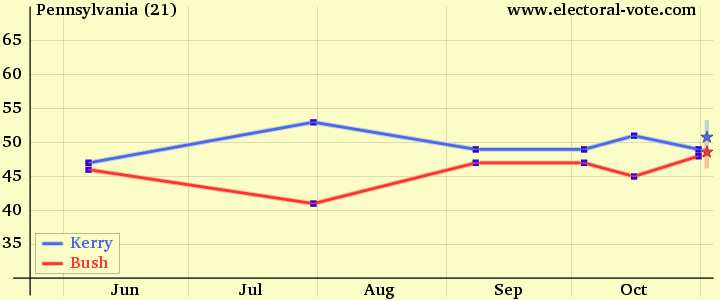
The y axis is the percentage of the voters who said they would vote for the candidate.
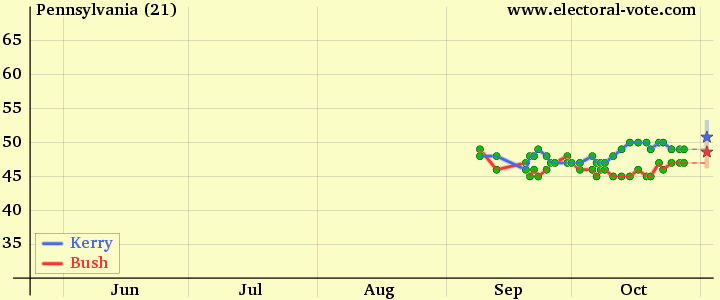
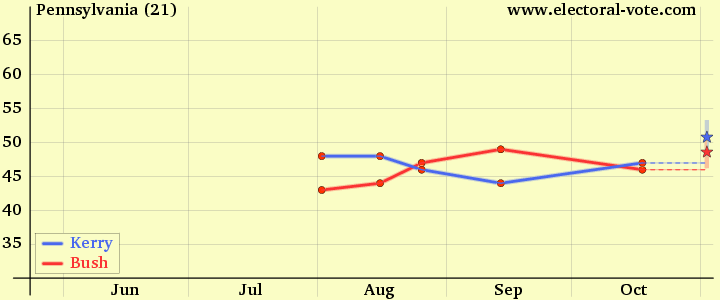
The upper graph is for the period May through October; the lower one is October only.
Every point is plotted on the middle date of its poll.
The bands just after election day show the exit polls and their MoEs. The stars indicate the final results.
For additional state polls, click on a state abbreviation:
AL
AK
AZ
AR
CA
CO
CT
DE
DC
FL
GA
HI
ID
IL
IN
IA
KS
KY
LA
ME
MD
MA
MI
MN
MS
MO
MT
NE
NV
NH
NJ
NM
NY
NC
ND
OH
OK
OR
PA
RI
SC
SD
TN
TX
UT
VT
VA
WA
WV
WI
WY
Gallup
Mason-Dixon
Quinnipiac Univ.
Rasmussen
Strategic
Survey USA
Zogby