| Jun. 18 | |
|
|
|
|
|
| Presidential polls today: | (None) | |
| Dem pickups (vs. 2004): | (None) | |
| GOP pickups (vs. 2004): | (None) |
News from the Votemaster
Here is more polling data. Again, take it with a grain of salt. If Fred Thompson jumps in in July, I'll start tracking him of course.
Also of interest is the enormous progress that has been made in the past two years in making sure electronic voting machines produce paper trails and that these paper trails are subject to random audits. Fifteen states require both paper trails and random audits and another 15 require paper trails but no random audits. In addition, a bill (HR 811) sponsored by congressman Rush Holt (D-NJ) is making its way through the House and if passed into law would require paper trails for all federal elections. Paper trails are extremely important to prevent insiders (mostly the company that makes the voting machines) from rigging elections. With voter verified paper trails this kind of insider rigging is difficult, if not impossible. For the state of play on this subject, see the Website of verifiedvoting.org.
| State | Pollster | End date | Clinton | Obama | Edwards | Giuliani | McCain | Romney |
| Alabama | U. of South Alabama | Apr. 19 | 33% | 25% | 12% | 28% | 23% | 3% |
| Alabama | Capital Survey | Mar. 6 | 35% | 19% | 9% | 28% | 23% | 3% |
| Alabama | ARG | Feb. 13 | 44% | 13% | 11% | 31% | 19% | 3% |
| Alabama | Capital Survey | Jan. 17 | 27% | 14% | 19% | 20% | 24% | 3% |
| Arizona | Rocky Mtn Poll | May 29 | 26% | 22% | 7% | 20% | 35% | 7% |
| Arizona | Arizona State U. | Apr. 22 | 25% | 20% | 18% | 27% | 32% | 11% |
| Arizona | Rocky Mtn Poll | Mar. 21 | 27% | 20% | 9% | 25% | 34% | 11% |
| Arizona | Arizona State U. | Feb. 25 | 28% | 24% | 14% | 25% | 44% | 6% |
| Arizona | ARG | Feb. 13 | 33% | 24% | 13% | 21% | 45% | 2% |
| Arizona | Rocky Mtn Poll | Jan. 22 | 32% | 15% | 18% | 13% | 40% | 11% |
| Arkansas | ARG | Mar. 23 | 49% | 16% | 12% | 12% | 21% | 4% |
| Arkansas | ARG | Mar. 19 | 49% | 16% | 12% | 12% | 21% | 4% |
| California | ARG | May 8 | 37% | 28% | 15% | 27% | 24% | 11% |
| California | Field Poll | Mar. 31 | 41% | 28% | 13% | 36% | 24% | 7% |
| California | SurveyUSA | Mar. 6 | 44% | 31% | 10% | 41% | 23% | 8% |
| California | Datamar | Feb. 15 | 34% | 24% | 16% | 41% | 17% | 11% |
| California | ARG | Jan. 17 | 36% | 33% | 6% | 33% | 18% | 3% |
| Colorado | ARG | Apr. 2 | 34% | 23% | 17% | 25% | 23% | 9% |
| Connecticut | Quinnipiac U. | May 7 | 28% | 20% | 8% | 36% | 15% | 9% |
| Connecticut | Quinnipiac U. | Feb. 12 | 33% | 21% | 5% | 43% | 27% | 4% |
| Connecticut | ARG | Feb. 6 | 40% | 8% | 10% | 32% | 21% | 14% |
| Delaware | FDU | Feb. 25 | 34% | 19% | 10% | 0% | 0% | 0% |
| Florida | Zogby | June 6 | 36% | 16% | 11% | 31% | 12% | 12% |
| Florida | Quinnipiac U. | June 4 | 34% | 16% | 11% | 31% | 10% | 8% |
| Florida | Schroth/Polling Co. | May 9 | 42% | 19% | 12% | 29% | 15% | 14% |
| Florida | ARG | May 8 | 45% | 17% | 15% | 31% | 18% | 11% |
| Florida | Quinnipiac U. | Apr. 24 | 36% | 13% | 11% | 38% | 15% | 7% |
| Florida | U. of North Florida | Apr. 13 | 35% | 20% | 9% | 31% | 14% | 6% |
| Florida | Quinnipiac U. | Mar. 27 | 36% | 13% | 11% | 35% | 15% | 5% |
| Florida | Quinnipiac U. | Mar. 4 | 38% | 13% | 6% | 38% | 18% | 6% |
| Florida | Quinnipiac U. | Feb. 4 | 49% | 13% | 7% | 29% | 23% | 6% |
| Florida | ARG | Jan. 9 | 30% | 14% | 15% | 30% | 15% | 2% |
| Illinois | ARG | Jan. 14 | 30% | 36% | 5% | 33% | 24% | 12% |
| Iowa | ARG | May 27 | 31% | 11% | 25% | 23% | 25% | 16% |
| Iowa | Selzer | May 16 | 21% | 23% | 29% | 17% | 18% | 30% |
| Iowa | Research 2000 | May 15 | 28% | 22% | 26% | 17% | 18% | 16% |
| Iowa | Zogby | May 15 | 24% | 22% | 26% | 16% | 18% | 17% |
| Iowa | ARG | Apr. 30 | 23% | 19% | 27% | 19% | 26% | 14% |
| Iowa | U. of Iowa | Mar. 31 | 28% | 19% | 34% | 21% | 20% | 17% |
| Iowa | Zogby | Mar. 26 | 25% | 23% | 27% | 25% | 19% | 11% |
| Iowa | ARG | Mar. 23 | 34% | 16% | 33% | 29% | 29% | 10% |
| Iowa | ARG | Mar. 22 | 34% | 33% | 16% | 29% | 29% | 10% |
| Iowa | Zogby | Feb. 9 | 24% | 24% | 18% | 19% | 17% | 5% |
| Iowa | Zogby | Jan. 16 | 16% | 27% | 17% | 19% | 17% | 5% |
| Kansas | Research 2000 | May 23 | 27% | 22% | 21% | 13% | 13% | 17% |
| Kansas | Research 2000 | May 23 | 27% | 22% | 21% | 13% | 13% | 17% |
| Maine | Critical Insights | Apr. 27 | 39% | 22% | 16% | 24% | 21% | 12% |
| Maine | ARG | Feb. 6 | 41% | 14% | 17% | 33% | 22% | 13% |
| Massachusetts | Suffolk U. | Apr. 15 | 32% | 18% | 19% | 0% | 0% | 0% |
| Massachusetts | ARG | Feb. 6 | 35% | 24% | 19% | 29% | 30% | 7% |
| Michigan | ARG | May 7 | 38% | 25% | 14% | 19% | 22% | 24% |
| Michigan | EPIC/MRA | Mar. 18 | 45% | 29% | 16% | 26% | 30% | 21% |
| Michigan | ARG | Mar. 4 | 35% | 30% | 14% | 30% | 35% | 0% |
| Michigan | EPIC/MRA | Feb. 4 | 49% | 20% | 8% | 32% | 28% | 8% |
| Michigan | ARG | Jan. 7 | 30% | 30% | 17% | 34% | 24% | 10% |
| Missouri | ARG | Jan. 9 | 30% | 18% | 17% | 18% | 31% | 2% |
| Nevada | Mason-Dixon | May 1 | 37% | 12% | 13% | 12% | 19% | 15% |
| Nevada | Zogby | Apr. 12 | 35% | 21% | 15% | 37% | 15% | 15% |
| Nevada | Research 2000 | Mar. 8 | 32% | 20% | 11% | 38% | 18% | 4% |
| New Hampshire | U of New Hampshire | June 11 | 36% | 22% | 12% | 22% | 20% | 29% |
| New Hampshire | Mason-Dixon | June 7 | 26% | 21% | 18% | 15% | 16% | 27% |
| New Hampshire | Franklin Pierce Coll. | June 6 | 41% | 17% | 15% | 20% | 18% | 30% |
| New Hampshire | ARG | May 27 | 34% | 15% | 18% | 21% | 30% | 23% |
| New Hampshire | Zogby | May 16 | 28% | 26% | 15% | 19% | 19% | 35% |
| New Hampshire | ARG | Apr. 29 | 37% | 14% | 26% | 17% | 29% | 24% |
| New Hampshire | Zogby | Apr. 3 | 29% | 23% | 23% | 19% | 25% | 25% |
| New Hampshire | U. of New Hampshire | Apr. 3 | 27% | 20% | 21% | 29% | 29% | 17% |
| New Hampshire | ARG | Mar. 23 | 37% | 23% | 20% | 19% | 23% | 17% |
| New Hampshire | Franklin Pierce Coll. | Mar. 12 | 32% | 25% | 16% | 28% | 29% | 22% |
| New Hampshire | Suffolk U. | Feb. 28 | 28% | 26% | 17% | 37% | 27% | 17% |
| New Hampshire | Zogby/UNH | Feb. 8 | 27% | 23% | 13% | 27% | 28% | 13% |
| New Hampshire | Zogby | Jan. 17 | 19% | 19% | 23% | 20% | 26% | 13% |
| New Jersey | Monmouth U. | Apr. 16 | 41% | 22% | 13% | 49% | 19% | 6% |
| New Jersey | Quinnipiac U. | Apr. 16 | 38% | 16% | 9% | 49% | 18% | 6% |
| New Jersey | FDU | Mar. 4 | 46% | 18% | 10% | 59% | 20% | 6% |
| New Jersey | Quinnipiac U. | Feb. 25 | 41% | 19% | 5% | 58% | 15% | 2% |
| New Jersey | Quinnipiac U. | Jan. 22 | 30% | 8% | 16% | 39% | 21% | 5% |
| New Mexico | ARG | Jan. 13 | 22% | 17% | 12% | 38% | 20% | 7% |
| New York | Siena Coll. | May 25 | 42% | 13% | 7% | 50% | 12% | 7% |
| New York | Siena Coll. | Apr. 20 | 39% | 17% | 11% | 47% | 16% | 8% |
| New York | Blum+Weprin | Apr. 7 | 49% | 17% | 11% | 56% | 15% | 5% |
| New York | ARG | Apr. 2 | 41% | 20% | 16% | 50% | 14% | 7% |
| New York | Quinnipiac U. | Apr. 2 | 44% | 14% | 9% | 52% | 13% | 6% |
| New York | Siena Coll. | Mar. 22 | 43% | 11% | 7% | 31% | 20% | 6% |
| New York | Quinnipiac U. | Feb. 11 | 47% | 16% | 7% | 51% | 17% | 1% |
| North Carolina | Elon U. | Apr. 19 | 20% | 20% | 26% | 32% | 22% | 10% |
| North Carolina | ARG | Jan. 15 | 26% | 19% | 30% | 34% | 26% | 2% |
| Ohio | Quinnipiac U. | May 13 | 38% | 19% | 11% | 23% | 17% | 11% |
| Ohio | Quinnipiac U. | Apr. 24 | 37% | 14% | 17% | 23% | 21% | 6% |
| Ohio | Quinnipiac U. | Mar. 19 | 32% | 22% | 11% | 31% | 20% | 6% |
| Ohio | Quinnipiac U. | Mar. 4 | 32% | 19% | 13% | 35% | 18% | 3% |
| Ohio | U. of Akron | Feb. 21 | 42% | 16% | 17% | 36% | 28% | 6% |
| Ohio | Quinnipiac U. | Jan. 28 | 38% | 11% | 13% | 30% | 22% | 4% |
| Oklahoma | Sooner | Apr. 30 | 29% | 13% | 29% | 32% | 23% | 6% |
| Oklahoma | ARG | Feb. 13 | 40% | 15% | 16% | 37% | 21% | 2% |
| Oregon | Riley Research | Mar. 13 | 31% | 21% | 8% | 33% | 20% | 5% |
| Pennsylvania | Quinnipiac U. | Apr. 24 | 36% | 14% | 13% | 29% | 17% | 5% |
| Pennsylvania | Quinnipiac U. | Mar. 25 | 36% | 17% | 9% | 33% | 18% | 5% |
| Pennsylvania | Quinnipiac U. | Mar. 4 | 29% | 18% | 11% | 43% | 17% | 6% |
| Pennsylvania | Susquehanna | Feb. 20 | 42% | 16% | 11% | 37% | 29% | 6% |
| Pennsylvania | Quinnipiac U. | Feb. 5 | 37% | 11% | 11% | 30% | 20% | 4% |
| Pennsylvania | ARG | Jan. 8 | 32% | 12% | 13% | 35% | 25% | 1% |
| Rhode Island | Brown U. | Jan. 27 | 33% | 8% | 15% | 0% | 0% | 0% |
| South Carolina | Winthrop U. | May 27 | 29% | 21% | 11% | 19% | 14% | 12% |
| South Carolina | ARG | May 26 | 34% | 18% | 30% | 23% | 32% | 10% |
| South Carolina | ARG | Apr. 30 | 36% | 24% | 18% | 23% | 36% | 6% |
| South Carolina | Hamilton/McHenry | Apr. 19 | 31% | 27% | 16% | 15% | 24% | 10% |
| South Carolina | Zogby | Apr. 17 | 33% | 26% | 21% | 19% | 22% | 10% |
| South Carolina | ARG | Feb. 27 | 36% | 25% | 20% | 29% | 35% | 5% |
| Texas | U. of Texas | May 7 | 33% | 21% | 8% | 23% | 27% | 6% |
| Texas | ARG | Mar. 19 | 34% | 32% | 11% | 30% | 20% | 13% |
| Utah | ARG | Feb. 13 | 31% | 18% | 9% | 13% | 21% | 40% |
| Vermont | ARG | Feb. 6 | 37% | 19% | 14% | 29% | 30% | 7% |
| West Virginia | ARG | Apr. 2 | 37% | 22% | 19% | 29% | 33% | 8% |
| Wisconsin | St. Norbert Coll. | Apr. 17 | 33% | 30% | 18% | 26% | 24% | 9% |
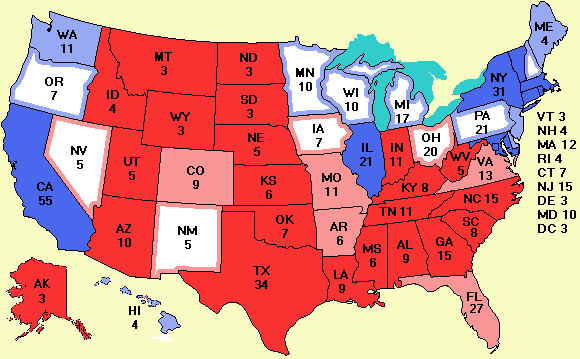
This page is the prototype for 2008. The data and map will refer to previous elections until serious polls begin in 2008. The blog will be updated when there is interesting news about the 2008 races.
Preview of the 2008 races: President Senate HouseThis map shows the current governors. Put your mouse on a state for more information.

This map shows the current Senate. Put your mouse on a state for more information.

This map shows the current House. Put your mouse on a state for more information.

-- The Votemaster