| Apr. 30 | |
|
|
|
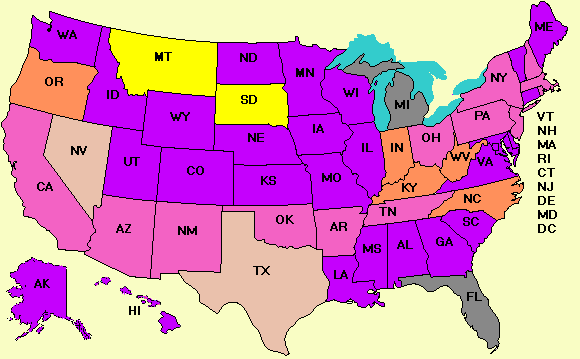
| DEMOCRATIC PRIMARIES AND CAUCUSES 2008 | Click for Republican primaries and caucuses |
|
|
| Click for the Obama-McCain general election map | Click for the Clinton-McCain general election map |
News from the Votemaster
Four Michigan Democrats have launched a new proposal for seating the Michigan delegates. One of them is Sen. Carl Levin (D-MI), who is almost single-handedly responsible for the problem in the first place since it was he who championed the idea of violating DNC rules and having Michigan vote on January 15. The group says Clinton wants to accept the election results, which favor her 73 to 55 and Obama wants to split it 64 to 64, so let's compromise at 69 for Clinton and 59 for Obama. It is not clear if the DNC will buy this though. Many DNC members are very angry with Michigan for knowingly violating party rules.
Conservative NY Times columnist David Brooks had a column yesterday about how segmented America has become. In the 1950s, 80% of television viewers, rich and poor alike, watched Milton Berle on Tuesday nights. Millions of others read general-interest magazines like Look and Life. A rich man's son and a poor man's son might play on the same basketball team. That's all gone now. Everything is highly segmented with people looking for TV shows, magazines, sports teams, (and certainly blogs) for people like them. So with this election. Barack Obama poured millions into advertising in Pennsylvania, but the upscale college educated voters went for him and the downscale blue-collar women went for Hillary Clinton, the same as they would have had he not advertised. John Edwards said we have two Americas. Brooks cites Stuart Rothenberg's claim that we have two Democratic Parties, and each one has its own candidate and is not likely to budge until hammered into submission.
We have four new primary polls today. A Howey-Guage poll shows Indiana to be a statistical tie, different from yesterday's SurveyUSA poll putting Clinton ahead by 9%. The difference in these polls is often how hard the pollster pushes the undecideds to make a choice. Also noteworthy is the fact Democrats are split evenly 47% to 47% so three other groups may ultimately determine the winner here and possibly the nominee. First, independents are allowed to vote in the Democratic primary, and in previous states they have gone strongly for Obama. Second, there what are called "Obamacans," Republicans deeply disturbed by what the party of Eisenhower, Goldwater, and Reagan has become and think a big loss in November may help the party get back to its fundamental principles. Finally, we have the Limbacans, Republicans who support McCain and at the incessant urging of Rush Limbaugh are going to vote for Hillary Clinton because they perceive her to be the weaker candidate in November. This is an interesting group because Democrats are debating endlessly about which of their candidates is stronger, but Republicans have no doubt: Obama is the one they fear. They don't want the election to become a contest between young and old (like 1960).
In Kentucky, Clinton is headed for one of her biggest victories of the campaign and in North Carolina Obama continues to lead.
| State | Pollster | End date | Clinton | Obama |
| Indiana | Howey-Gauge | Apr. 24 | 45% | 47% |
| Kentucky | SurveyUSA | Apr. 28 | 63% | 27% |
| North Carolina | Rasmussen | Apr. 28 | 37% | 51% |
| North Carolina | SurveyUSA | Apr. 28 | 44% | 49% |
One general election poll, and there McCain beats either Democrat handily (19% against either one) in Alabama.
The April 25 posting had a table showing how liberal interest groups rated members of the House. Today we have a similar table with ratings from consevative groups. The eight groups used in this study are:
ACU - American Conservative UnionATR - Americans for Tax Reform
CWA - Concerned Women for America
Club4 - Club for Growth
Eagle - Eagle Forum
FRC - Family Research Council
RTL - Right to Life
TVC - Traditional Values Coalition
The ratings are for 2007 where available, otherwise for 2006. Actually, only the Eagle Forum had 2007 data, so all the others are 2006.
The data are available for download in .csv format so you can slice and dice the data as you wish. The liberal group ratings are also available in .csv format so you can combine them in Excel and play with the data as you wish. The two tables for the Senate as well as the two House tables are on the Data galore page under the menu so you can find them easily in the future.
This list shows the same thing the other three have shown: how polarized Congress is. Only five Democrats score above 60% in the eyes of conservatives, and four of these are from Republican districts in the South. Correspondingly, only four Republicans are below 40%, and one of these (Wayne Gilchrest) was already defeated by a primary challenger from the right, another one, Chris Shays, is the last surviving Republican in New England who probably won't survive this year, yet another (Mike Castle) is from the highly Democratic state of Delaware, and the last (Mark Kirk) is from IL-10, which has a PVI of D+4.
| CD | Rep | ACU | ATR | CWA | Club4 | Eagle | FRC | RTL | TVC | Mean |
| CO-05 | Doug Lamborn (R) | N/A | N/A | N/A | 100 | N/A | 100 | N/A | N/A | 100 |
| OH-04 | Jim Jordan (R) | N/A | N/A | N/A | 98 | N/A | 100 | N/A | N/A | 99 |
| AZ-02 | Trent Franks (R) | 100 | 100 | 100 | 100 | 100 | 100 | 100 | 85 | 98 |
| MN-06 | Michelle Bachmann (R) | N/A | N/A | N/A | 96 | N/A | 100 | N/A | N/A | 98 |
| NJ-05 | E. Scott Garrett (R) | 100 | 100 | 100 | 100 | 100 | 100 | 100 | 85 | 98 |
| IA-05 | Steve King (R) | 100 | 100 | 100 | 91 | 100 | 100 | 100 | 85 | 97 |
| ID-01 | Bill Sali (R) | N/A | N/A | N/A | 94 | N/A | 100 | N/A | N/A | 97 |
| TX-05 | Jeb Hensarling (R) | 100 | 95 | 100 | 100 | 100 | 100 | 100 | 85 | 97 |
| CO-04 | Marilyn Musgrave (R) | 96 | 100 | 100 | 94 | 100 | 100 | 100 | 85 | 96 |
| FL-24 | Tom Feeney (R) | 96 | 95 | 100 | 98 | 100 | 100 | 100 | 85 | 96 |
| GA-06 | Thomas Price (R) | 92 | 100 | 100 | 98 | 100 | 93 | 100 | 85 | 96 |
| MN-02 | John Kline (R) | 88 | 95 | 100 | 100 | 100 | 100 | 100 | 85 | 96 |
| MO-02 | W. Todd Akin (R) | 92 | 100 | 100 | 94 | 100 | 100 | 100 | 85 | 96 |
| NC-09 | Sue Myrick (R) | 92 | 100 | 100 | 96 | 100 | 100 | 100 | 85 | 96 |
| SC-03 | J. Gresham Barrett (R) | 96 | 100 | 100 | 90 | 100 | 100 | 100 | 85 | 96 |
| TN-07 | Marsha Blackburn (R) | 96 | 100 | 100 | 94 | 100 | 100 | 100 | 85 | 96 |
| CA-40 | Edward Royce (R) | 96 | 100 | 92 | 92 | 100 | 100 | 100 | 85 | 95 |
| CA-48 | John B.T. Campbell (R) | 88 | 95 | 100 | 100 | 100 | 93 | 100 | 85 | 95 |
| FL-01 | Jeff Miller (R) | 92 | 100 | 100 | 98 | 86 | 100 | 100 | 85 | 95 |
| FL-06 | Clifford Stearns (R) | 96 | 100 | 100 | 84 | 100 | 100 | N/A | 85 | 95 |
| GA-07 | John Linder (R) | 96 | 86 | 100 | 96 | 100 | 100 | 100 | 85 | 95 |
| TN-01 | David Davis (R) | N/A | N/A | N/A | 91 | N/A | 100 | N/A | N/A | 95 |
| TX-13 | William Thornberry (R) | 88 | 91 | 100 | 100 | 100 | 100 | 100 | 85 | 95 |
| TX-19 | Randy Neugebauer (R) | 100 | 95 | 100 | 86 | 100 | 100 | 100 | 85 | 95 |
| GA-03 | Lynn Westmoreland (R) | 92 | 95 | 100 | 100 | 100 | 81 | 100 | 85 | 94 |
| GA-09 | Nathan Deal (R) | 92 | 82 | 100 | 100 | 100 | 100 | 100 | 85 | 94 |
| NE-02 | Lee Terry (R) | 92 | 100 | 100 | 92 | 86 | 100 | 100 | 85 | 94 |
| PA-16 | Joseph Pitts (R) | 86 | 91 | 100 | 92 | 100 | 100 | 100 | 85 | 94 |
| SC-02 | Addison Wilson (R) | 91 | 95 | 100 | 86 | 100 | 100 | 100 | 85 | 94 |
| WI-01 | Paul Ryan (R) | 92 | 100 | 100 | 100 | 83 | 93 | 100 | 85 | 94 |
| MI-07 | Tim Walberg (R) | N/A | N/A | N/A | 86 | N/A | 100 | N/A | N/A | 93 |
| NV-02 | Dean Heller (R) | N/A | N/A | N/A | 100 | N/A | 87 | N/A | N/A | 93 |
| TX-11 | K. Michael Conaway (R) | 88 | 95 | 100 | 92 | 86 | 100 | 100 | 85 | 93 |
| VA-07 | Eric Cantor (R) | 92 | 100 | 100 | 82 | 100 | 87 | 100 | 85 | 93 |
| GA-11 | Phil Gingrey (R) | 92 | 95 | 100 | 74 | 100 | 93 | 100 | 85 | 92 |
| IN-05 | Dan Burton (R) | 88 | 91 | 100 | 78 | 100 | 100 | 100 | 85 | 92 |
| NC-10 | Patrick McHenry (R) | 92 | 95 | 100 | 71 | 100 | 100 | 100 | 85 | 92 |
| NE-03 | Adrian Smith (R) | N/A | N/A | N/A | 84 | N/A | 100 | N/A | N/A | 92 |
| TX-24 | Kenny Marchant (R) | 92 | 100 | 100 | 61 | 100 | 100 | 100 | 85 | 92 |
| WI-06 | Thomas Petri (R) | 76 | 95 | 100 | 94 | 86 | 100 | 100 | 85 | 92 |
| AZ-03 | John Shadegg (R) | 100 | 100 | 100 | 100 | 67 | 93 | 100 | 71 | 91 |
| IN-06 | Mike Pence (R) | 100 | 100 | 100 | 100 | 71 | 93 | 100 | 71 | 91 |
| MO-06 | Samuel Graves (R) | 88 | 95 | 100 | 76 | 100 | 87 | 100 | 83 | 91 |
| OH-01 | Steven Chabot (R) | 96 | 100 | 100 | 96 | 71 | 100 | 100 | 71 | 91 |
| OH-02 | Jean Schmidt (R) | 88 | 100 | 100 | 74 | 86 | 100 | 100 | 85 | 91 |
| TN-02 | John Duncan (R) | 88 | 100 | 100 | 88 | 71 | 100 | 100 | 85 | 91 |
| TX-02 | Ted Poe (R) | 84 | 91 | 93 | 82 | 100 | 100 | 100 | 85 | 91 |
| TX-03 | Samuel Robert Johnson (R) | 90 | 73 | 100 | 72 | 100 | 93 | 100 | 100 | 91 |
| TX-26 | Michael Burgess (R) | 83 | 95 | 100 | 71 | 100 | 100 | 100 | 85 | 91 |
| TX-32 | Peter Sessions (R) | 96 | 100 | 100 | 94 | 80 | 81 | 100 | 83 | 91 |
| UT-03 | Chris Cannon (R) | 90 | 95 | 100 | 96 | 83 | 100 | 100 | 71 | 91 |
| CA-02 | Walter Herger (R) | 92 | 100 | 100 | 47 | 100 | 100 | 100 | 85 | 90 |
| FL-08 | Ric Keller (R) | 88 | 86 | 100 | 68 | 100 | 100 | 100 | 85 | 90 |
| IN-03 | Mark Souder (R) | 88 | 100 | 100 | 55 | 100 | 93 | 100 | 85 | 90 |
| MI-08 | Mike Rogers (R) | 88 | 100 | 100 | 54 | 100 | 100 | 100 | 85 | 90 |
| NC-05 | Virginia Ann Foxx (R) | 96 | 100 | 100 | 43 | 100 | 100 | 100 | 85 | 90 |
| OK-01 | John Sullivan (R) | 92 | 95 | 100 | 94 | 86 | 75 | 100 | 85 | 90 |
| CO-06 | Tom Tancredo (R) | 92 | 95 | 93 | 84 | 100 | 68 | 100 | 85 | 89 |
| FL-07 | John Mica (R) | 92 | 100 | 100 | 56 | 86 | 100 | 100 | 85 | 89 |
| IL-19 | John Shimkus (R) | 83 | 95 | 92 | 76 | 86 | 100 | 100 | 85 | 89 |
| NM-02 | Stevan Pearce (R) | 92 | 100 | 100 | 82 | 71 | 100 | 100 | 71 | 89 |
| UT-01 | Rob Bishop (R) | 87 | 73 | 100 | 71 | 100 | 100 | 100 | 85 | 89 |
| VA-06 | Robert Goodlatte (R) | 92 | 100 | 100 | 36 | 100 | 100 | 100 | 85 | 89 |
| CA-03 | Daniel Lungren (R) | 84 | 100 | 92 | 74 | 86 | 100 | 100 | 71 | 88 |
| CA-19 | George Radanovich (R) | 88 | 100 | 100 | 52 | 100 | 81 | 100 | 85 | 88 |
| FL-12 | Adam Putnam (R) | 84 | 100 | 100 | 54 | 86 | 100 | 100 | 85 | 88 |
| IL-06 | Peter Roskam (R) | N/A | N/A | N/A | 76 | N/A | 100 | N/A | N/A | 88 |
| SC-04 | Robert Inglis (R) | 84 | 95 | 92 | 90 | 86 | 100 | 100 | 57 | 88 |
| TX-01 | Louis Gohmert (R) | 96 | 77 | 100 | 56 | 100 | 93 | 100 | 85 | 88 |
| TX-08 | Kevin Brady (R) | 88 | 95 | 100 | 38 | 100 | 100 | 100 | 85 | 88 |
| TX-10 | Michael McCaul (R) | 83 | 91 | 100 | 62 | 86 | 100 | 100 | 85 | 88 |
| WI-05 | Jim Sensenbrenner (R) | 83 | 86 | 100 | 100 | 71 | 100 | 100 | 71 | 88 |
| FL-15 | David Weldon (R) | 88 | 100 | 100 | 30 | 100 | 100 | 100 | 85 | 87 |
| GA-01 | Jack Kingston (R) | 92 | 77 | 93 | 52 | 100 | 100 | 100 | 85 | 87 |
| MI-02 | Peter Hoekstra (R) | 92 | 100 | 100 | 20 | 100 | 100 | 100 | 85 | 87 |
| MI-04 | David Lee Camp (R) | 84 | 100 | 100 | 44 | 86 | 100 | 100 | 85 | 87 |
| CA-24 | Elton Gallegly (R) | 84 | 100 | 100 | 26 | 100 | 100 | 100 | 85 | 86 |
| NE-01 | Jeff Fortenberry (R) | 84 | 95 | 100 | 38 | 86 | 100 | 100 | 85 | 86 |
| OH-08 | John Boehner (R) | 88 | 100 | 100 | 60 | 71 | 100 | 100 | 71 | 86 |
| AL-06 | Spencer Bachus (R) | 88 | 100 | 100 | 7 | 100 | 100 | 100 | 85 | 85 |
| CA-42 | Gary Miller (R) | 88 | 100 | 100 | 24 | 100 | 87 | 100 | 85 | 85 |
| MD-06 | Roscoe Bartlett (R) | 84 | 91 | 93 | 27 | 100 | 100 | 100 | 85 | 85 |
| MO-09 | Kenny Hulshof (R) | 80 | 95 | 100 | 22 | 100 | 100 | 100 | 85 | 85 |
| TX-31 | John Carter (R) | 88 | 86 | 100 | 38 | 86 | 100 | 100 | 85 | 85 |
| CA-21 | Devin Nunes (R) | 84 | N/A | 92 | 69 | 71 | 93 | 100 | 85 | 84 |
| IN-04 | Stephen Buyer (R) | 83 | 64 | 100 | 60 | 100 | 81 | 100 | 85 | 84 |
| MO-07 | Roy Blunt (R) | 88 | 100 | 100 | 22 | 83 | 100 | 100 | 85 | 84 |
| OH-12 | Patrick Tiberi (R) | 84 | 95 | 93 | 38 | 86 | 93 | 100 | 85 | 84 |
| PA-09 | Bill Shuster (R) | 84 | 95 | 100 | 24 | 100 | 87 | 100 | 85 | 84 |
| TX-04 | Ralph Moody Hall (R) | 84 | 91 | 100 | 32 | 86 | 100 | 100 | 85 | 84 |
| VA-05 | Virgil Goode (R) | 88 | 95 | 100 | 11 | 100 | 100 | 100 | 85 | 84 |
| WA-04 | Doc Hastings (R) | 88 | 100 | 92 | 22 | 86 | 100 | 100 | 85 | 84 |
| AR-03 | John Boozman (R) | 92 | 100 | 100 | 8 | 86 | 100 | 100 | 85 | 83 |
| AZ-06 | Jeff Flake (R) | 100 | 91 | 77 | 100 | 67 | 93 | 100 | 42 | 83 |
| CA-04 | John Doolittle (R) | 84 | 95 | 100 | 2 | 100 | 100 | 100 | 85 | 83 |
| CA-22 | Kevin McCarthy (R) | N/A | N/A | N/A | 66 | N/A | 100 | N/A | N/A | 83 |
| IL-15 | Timothy Johnson (R) | 76 | 82 | 93 | 44 | 86 | 100 | 100 | 85 | 83 |
| IL-16 | Donald Manzullo (R) | 91 | 82 | 100 | 8 | 100 | 100 | 100 | 85 | 83 |
| KY-02 | Ron Lewis (R) | 84 | 95 | 100 | 4 | 100 | 100 | 100 | 85 | 83 |
| NC-08 | Robert Hayes (R) | 88 | 91 | 100 | 2 | 100 | 100 | 100 | 85 | 83 |
| NY-26 | Thomas Reynolds (R) | 87 | 100 | 100 | 4 | 100 | 93 | 100 | 85 | 83 |
| TN-03 | Zach Wamp (R) | 88 | 95 | 100 | 12 | 86 | 100 | 100 | 85 | 83 |
| TX-07 | John Culberson (R) | 88 | 86 | 100 | 10 | 100 | 100 | 100 | 85 | 83 |
| TX-21 | Lamar Smith (R) | 84 | 95 | 100 | 16 | 86 | 100 | 100 | 85 | 83 |
| AL-03 | Michael Rogers (R) | 84 | 91 | 100 | 0 | 100 | 100 | 100 | 85 | 82 |
| KS-04 | Todd Tiahrt (R) | 84 | 91 | 100 | 0 | 100 | 100 | 100 | 83 | 82 |
| MI-10 | Candice Miller (R) | 84 | 100 | 100 | 14 | 100 | 93 | 100 | 71 | 82 |
| NC-06 | John Howard Coble (R) | 92 | 82 | 77 | 87 | 86 | 87 | 80 | 71 | 82 |
| OK-03 | Frank Lucas (R) | 88 | 95 | 100 | 6 | 86 | 100 | 100 | 85 | 82 |
| OK-04 | Tom Cole (R) | 84 | 95 | 100 | 8 | 86 | 100 | 100 | 85 | 82 |
| SC-01 | Henry Brown (R) | 84 | 95 | 100 | 8 | 86 | 100 | 100 | 85 | 82 |
| VA-02 | Thelma Drake (R) | 88 | 100 | 100 | 4 | 86 | 100 | 100 | 85 | 82 |
| AL-02 | Terry Everett (R) | 88 | 91 | 100 | 4 | 86 | 100 | 100 | 85 | 81 |
| CA-52 | Duncan Hunter (R) | 88 | 100 | 100 | 26 | 100 | 56 | 100 | 85 | 81 |
| FL-04 | Ander Crenshaw (R) | 84 | 100 | 100 | 5 | 86 | 93 | 100 | 85 | 81 |
| IA-04 | Thomas Latham (R) | 84 | 91 | 100 | 4 | 86 | 100 | 100 | 85 | 81 |
| KS-01 | Jerry Moran (R) | 84 | 95 | 100 | 4 | 86 | 100 | 100 | 85 | 81 |
| KY-04 | Geoff Davis (R) | 84 | 95 | 100 | 12 | 86 | 93 | 100 | 85 | 81 |
| NY-03 | Peter King (R) | 76 | 95 | 100 | 2 | 100 | 93 | 100 | 85 | 81 |
| OH-03 | Michael Turner (R) | 80 | 100 | 100 | 2 | 86 | 100 | 100 | 85 | 81 |
| VA-04 | James Randy Forbes (R) | 92 | 91 | 100 | 19 | 83 | 81 | 100 | 85 | 81 |
| CA-49 | Darrell Issa (R) | 80 | 95 | 77 | 86 | 86 | 68 | 80 | 71 | 80 |
| LA-05 | Rodney Alexander (R) | 80 | 95 | 100 | 0 | 86 | 100 | 100 | 85 | 80 |
| LA-07 | Charles Boustany (R) | 80 | 95 | 100 | 0 | 86 | 100 | 100 | 85 | 80 |
| MT-AL | Dennis Rehberg (R) | 83 | 95 | 93 | 0 | 86 | 100 | 100 | 85 | 80 |
| NC-03 | Walter Beaman Jones (R) | 79 | 64 | 100 | 18 | 100 | 100 | 100 | 85 | 80 |
| PA-05 | John Peterson (R) | 88 | 82 | 100 | 0 | 86 | 100 | 100 | 85 | 80 |
| AL-01 | Josiah Bonner (R) | 88 | 100 | 100 | 2 | 86 | 75 | 100 | 85 | 79 |
| AL-04 | Robert Aderholt (R) | 84 | 82 | 100 | 0 | 86 | 100 | 100 | 85 | 79 |
| IL-11 | Gerald Weller (R) | 80 | 95 | 92 | 4 | 86 | 93 | 100 | 85 | 79 |
| KY-01 | Edward Whitfield (R) | 76 | 95 | 100 | 4 | 86 | 93 | 100 | 85 | 79 |
| LA-04 | James McCrery (R) | 88 | 95 | 100 | 2 | 86 | 81 | 100 | 85 | 79 |
| WA-05 | Cathy McMorris-Rodgers (R) | 96 | N/A | 100 | 6 | 85 | 87 | 100 | 85 | 79 |
| FL-14 | Connie Mack (R) | 84 | 95 | 71 | 90 | 71 | 75 | 82 | 57 | 78 |
| KY-05 | Harold Rogers (R) | 80 | 73 | 100 | 0 | 86 | 100 | 100 | 85 | 78 |
| MI-11 | Thaddeus McCotter (R) | 83 | 86 | 93 | 2 | 86 | 93 | 100 | 85 | 78 |
| MS-03 | Charles Pickering (R) | 84 | 91 | 100 | 2 | 100 | 68 | 100 | 85 | 78 |
| PA-18 | Tim Murphy (R) | 80 | 95 | 93 | 0 | 86 | 100 | 91 | 85 | 78 |
| WY-AL | Barbara Cubin (R) | 91 | 95 | 100 | 10 | 100 | 50 | 100 | 85 | 78 |
| AZ-01 | Richard Renzi (R) | 84 | 95 | 100 | 0 | 71 | 100 | 100 | 71 | 77 |
| CA-46 | Dana Rohrabacher (R) | 88 | 100 | 54 | 86 | 86 | 81 | 80 | 42 | 77 |
| FL-10 | Bill Young (R) | 84 | 86 | 92 | 6 | 86 | 87 | 90 | 85 | 77 |
| MI-09 | Joseph Knollenberg (R) | 75 | 91 | 92 | 0 | 71 | 87 | 100 | 100 | 77 |
| NY-13 | Vito Fossella (R) | 75 | 91 | 71 | 81 | 71 | 75 | 82 | 71 | 77 |
| NY-29 | John Kuhl (R) | 83 | 95 | 100 | 0 | 71 | 87 | 100 | 85 | 77 |
| OH-07 | David Lee Hobson (R) | 76 | 86 | 100 | 6 | 86 | 62 | 100 | 100 | 77 |
| TX-06 | Joe Barton (R) | 88 | 91 | 75 | 64 | 71 | 87 | 70 | 71 | 77 |
| CA-26 | David Dreier (R) | 72 | 100 | 71 | 34 | 86 | 81 | 82 | 85 | 76 |
| FL-13 | Vern Buchanan (R) | N/A | N/A | N/A | 52 | N/A | 100 | N/A | N/A | 76 |
| FL-25 | Mario Diaz-Balart (R) | 64 | 100 | 93 | 12 | 71 | 87 | 100 | 85 | 76 |
| ID-02 | Michael Simpson (R) | 80 | 86 | 93 | 4 | 71 | 81 | 100 | 85 | 75 |
| MI-03 | Vernon Ehlers (R) | 68 | 77 | 100 | 45 | 57 | 87 | 100 | 71 | 75 |
| CA-50 | Brian Bilbray (R) | 94 | N/A | 60 | 78 | 75 | 75 | 67 | 71 | 74 |
| FL-05 | Virginia Brown-Waite (R) | 88 | 100 | 71 | 46 | 71 | 75 | 70 | 71 | 74 |
| NY-23 | John McHugh (R) | 75 | 68 | 93 | 2 | 86 | 87 | 100 | 85 | 74 |
| IL-18 | Ray LaHood (R) | 80 | 95 | 93 | 0 | 71 | 62 | 100 | 85 | 73 |
| MI-06 | Frederick Stephen Upton (R) | 80 | 95 | 79 | 42 | 71 | 68 | 82 | 71 | 73 |
| MS-04 | Gene Taylor (D) | 68 | 45 | 100 | 8 | 86 | 93 | 100 | 85 | 73 |
| PA-19 | Todd Platts (R) | 72 | 86 | 71 | 58 | 71 | 75 | 82 | 71 | 73 |
| FL-21 | Lincoln Diaz-Balart (R) | 60 | 95 | 93 | 0 | 57 | 87 | 100 | 85 | 72 |
| VA-10 | Frank Rudolph Wolf (R) | 64 | 64 | 92 | 4 | 71 | 100 | 100 | 85 | 72 |
| CA-25 | Howard McKeon (R) | 80 | 100 | 77 | 4 | 71 | 87 | 80 | 71 | 71 |
| NJ-04 | Christopher Smith (R) | 68 | 82 | 100 | 4 | 50 | 100 | 100 | 71 | 71 |
| FL-18 | Ileana Ros-Lehtinen (R) | 63 | 91 | 92 | 0 | 50 | 81 | 100 | 85 | 70 |
| NJ-03 | H. James Saxton (R) | 68 | 86 | 93 | 4 | 57 | 81 | 100 | 71 | 70 |
| NJ-07 | Michael Ferguson (R) | 64 | 86 | 100 | 2 | 57 | 81 | 100 | 71 | 70 |
| CA-44 | Ken Calvert (R) | 80 | 100 | 79 | 0 | 57 | 87 | 82 | 71 | 69 |
| MN-07 | Collin Peterson (D) | 72 | 41 | 92 | 0 | 86 | 81 | 100 | 85 | 69 |
| PA-03 | Philip English (R) | 80 | 95 | 93 | 2 | 57 | 75 | 100 | 57 | 69 |
| NY-25 | James Walsh (R) | 63 | 68 | 100 | 0 | 57 | 87 | 100 | 71 | 68 |
| TX-14 | Ronald Paul (R) | 76 | 82 | 62 | 29 | 100 | 56 | 56 | 85 | 68 |
| MO-08 | Jo Ann Emerson (R) | 72 | 82 | 79 | 0 | 71 | 87 | 80 | 71 | 67 |
| TN-04 | Lincoln Davis (D) | 80 | 59 | 100 | 4 | 43 | 81 | 100 | 71 | 67 |
| TX-12 | Kay Granger (R) | 76 | 82 | 69 | 21 | 71 | 68 | 80 | 71 | 67 |
| NC-07 | Mike McIntyre (D) | 64 | 50 | 93 | 0 | 57 | 100 | 100 | 71 | 66 |
| NJ-02 | Frank LoBiondo (R) | 68 | 82 | 86 | 4 | 43 | 75 | 100 | 71 | 66 |
| NV-03 | Jon Christopher Porter (R) | 80 | 95 | 64 | 10 | 71 | 62 | 82 | 71 | 66 |
| GA-08 | James Marshall (D) | 72 | 41 | 93 | 20 | 43 | 87 | 100 | 66 | 65 |
| FL-09 | Gus Bilirakis (R) | N/A | N/A | N/A | 26 | N/A | 100 | N/A | N/A | 63 |
| OH-16 | Ralph Regula (R) | 71 | 64 | 79 | 0 | 57 | 81 | 82 | 71 | 63 |
| OK-05 | Mary Fallin (R) | N/A | N/A | N/A | 26 | N/A | 100 | N/A | N/A | 63 |
| OR-02 | Greg Walden (R) | 80 | 91 | 69 | 26 | 57 | 50 | 60 | 71 | 63 |
| OH-14 | Steven LaTourette (R) | 72 | 86 | 77 | 6 | 57 | 68 | 80 | 57 | 62 |
| AK-AL | Donald Young (R) | 72 | 77 | 69 | 6 | 43 | 81 | 80 | 57 | 60 |
| MN-03 | James Ramstad (R) | 68 | 86 | 71 | 84 | 29 | 37 | 55 | 57 | 60 |
| NM-01 | Heather Wilson (R) | 67 | 73 | 67 | 10 | 57 | 75 | 78 | 57 | 60 |
| WV-02 | Shelley Moore Capito (R) | 80 | 95 | 71 | 0 | 43 | 68 | 55 | 71 | 60 |
| CA-41 | Jerry Lewis (R) | 67 | 86 | 71 | 0 | 43 | 68 | 82 | 57 | 59 |
| OH-15 | Deborah Pryce (R) | 72 | 95 | 79 | 4 | 57 | 31 | 64 | 71 | 59 |
| PA-06 | Jim Gerlach (R) | 62 | 82 | 62 | 16 | 50 | 62 | 70 | 71 | 59 |
| OK-02 | David Daniel Boren (D) | 72 | 77 | 79 | 2 | 29 | 68 | 82 | 57 | 58 |
| VA-11 | Thomas Davis (R) | 56 | 82 | 71 | 28 | 43 | 43 | 82 | 57 | 57 |
| WV-03 | Nick Joe Rahall (D) | 48 | 23 | 92 | 2 | 43 | 75 | 100 | 71 | 56 |
| LA-03 | Charles Melancon (D) | 76 | 59 | 69 | 2 | 43 | 56 | 82 | 57 | 55 |
| WA-08 | David George Reichert (R) | 56 | 73 | 69 | 4 | 43 | 56 | 82 | 57 | 55 |
| IL-12 | Jerry Costello (D) | 48 | 23 | 93 | 0 | 29 | 75 | 100 | 57 | 53 |
| PA-17 | Tim Holden (D) | 64 | 23 | 79 | 2 | 67 | 37 | 100 | 57 | 53 |
| WV-01 | Alan Mollohan (D) | 46 | 23 | 86 | 0 | 43 | 56 | 100 | 71 | 53 |
| GA-12 | John Barrow (D) | 76 | 64 | 64 | 20 | 43 | 31 | 36 | 71 | 50 |
| NC-11 | Heath Shuler (D) | N/A | N/A | N/A | 0 | N/A | 100 | N/A | N/A | 50 |
| TX-28 | Henry Cuellar (D) | 68 | 68 | 64 | 2 | 43 | 25 | 80 | 57 | 50 |
| NJ-11 | Rodney Frelinghuysen (R) | 60 | 82 | 69 | 0 | 29 | 25 | 50 | 71 | 48 |
| CA-45 | Mary Mack (R) | 68 | 77 | 60 | 15 | 29 | 31 | 44 | 57 | 47 |
| IL-03 | Daniel Lipinski (D) | 33 | 9 | 93 | 0 | 29 | 62 | 100 | 57 | 47 |
| MO-04 | Ike Skelton (D) | 50 | 36 | 71 | 2 | 43 | 50 | 82 | 42 | 47 |
| AR-01 | Robert Berry (D) | 56 | 32 | 79 | 2 | 29 | 31 | 82 | 57 | 46 |
| PA-15 | Charles Dent (R) | 72 | 95 | 50 | 12 | 29 | 31 | 27 | 57 | 46 |
| AL-05 | Robert Cramer (D) | 68 | 59 | 64 | 0 | 29 | 31 | 55 | 57 | 45 |
| MI-01 | Bart Stupak (D) | 28 | 14 | 77 | 2 | 33 | 56 | 100 | 42 | 44 |
| AR-04 | Mike Ross (D) | 60 | 27 | 71 | 2 | 29 | 31 | 64 | 57 | 42 |
| IL-13 | Judy Biggert (R) | 64 | 95 | 50 | 50 | 29 | 31 | 9 | 14 | 42 |
| CO-03 | John Salazar (D) | N/A | 27 | 62 | 2 | 57 | 12 | 60 | 71 | 41 |
| MN-08 | James Oberstar (D) | 22 | 9 | 80 | 2 | 43 | 37 | 100 | 42 | 41 |
| UT-02 | Jim Matheson (D) | 64 | 59 | 64 | 10 | 14 | 12 | 55 | 57 | 41 |
| IN-08 | Brad Ellsworth (D) | N/A | N/A | N/A | 0 | N/A | 81 | N/A | N/A | 40 |
| TN-06 | Bart Gordon (D) | 60 | 45 | 62 | 4 | 14 | 25 | 50 | 57 | 39 |
| DE-AL | Michael Castle (R) | 52 | 77 | 43 | 40 | 29 | 18 | 10 | 40 | 38 |
| IL-10 | Mark Kirk (R) | 54 | 82 | 50 | 19 | 29 | 12 | 9 | 42 | 37 |
| IN-02 | Joe Donneley (D) | N/A | N/A | N/A | 0 | N/A | 75 | N/A | N/A | 37 |
| MI-05 | Dale Kildee (D) | 20 | 9 | 64 | 0 | 29 | 25 | 100 | 42 | 36 |
| TN-08 | John Tanner (D) | 58 | 50 | 71 | 2 | 14 | 25 | 45 | 28 | 36 |
| TX-17 | Thomas Edwards (D) | 68 | 59 | 57 | 0 | 0 | 18 | 45 | 42 | 36 |
| FL-02 | Allen Boyd (D) | 63 | 41 | 62 | 2 | 14 | 6 | 20 | 57 | 33 |
| KY-06 | Albert Chandler (D) | 50 | 27 | 64 | 2 | 14 | 12 | 55 | 42 | 33 |
| TX-27 | Solomon Ortiz (D) | 40 | 23 | 62 | 0 | 29 | 6 | 80 | 28 | 33 |
| MD-01 | Wayne Gilchrest (R) | 48 | 86 | 38 | 0 | 29 | 18 | 20 | 14 | 31 |
| PA-11 | Paul Kanjorski (D) | 29 | 14 | 50 | 4 | 33 | 18 | 73 | 28 | 31 |
| TN-05 | Jim Cooper (D) | 40 | 23 | 46 | 98 | 0 | 12 | 20 | 14 | 31 |
| CA-20 | Jim Costa (D) | 56 | 41 | 46 | 4 | 14 | 6 | 20 | 57 | 30 |
| GA-02 | Sanford Bishop (D) | 64 | 36 | 57 | 2 | 14 | 6 | 36 | 28 | 30 |
| PA-12 | John Murtha (D) | 28 | 18 | 50 | 0 | 29 | 18 | 70 | 28 | 30 |
| SD-AL | Stephanie Herseth-Sandlin (D) | 60 | 27 | 57 | 2 | 29 | 18 | 9 | 42 | 30 |
| CA-18 | Dennis Cardoza (D) | 46 | 32 | 54 | 2 | 20 | 6 | 22 | 42 | 28 |
| IA-03 | Leonard Boswell (D) | 44 | 41 | 62 | 2 | 14 | 6 | 20 | 42 | 28 |
| ND-AL | Earl Pomeroy (D) | 38 | 18 | 57 | 2 | 14 | 18 | 55 | 28 | 28 |
| OH-06 | Charlie Wilson (D) | N/A | N/A | N/A | 0 | N/A | 56 | N/A | N/A | 28 |
| OH-17 | Timothy Ryan (D) | 28 | 14 | 46 | 0 | 29 | 6 | 80 | 28 | 28 |
| NC-02 | Bob Etheridge (D) | 44 | 18 | 64 | 0 | 14 | 25 | 27 | 28 | 27 |
| OH-09 | Marcy Kaptur (D) | 21 | 9 | 62 | 0 | 29 | 31 | 36 | 28 | 27 |
| RI-02 | James Langevin (D) | 16 | 18 | 57 | 2 | 29 | 0 | 73 | 28 | 27 |
| MA-09 | Stephen Lynch (D) | 20 | 18 | 57 | 2 | 29 | 6 | 55 | 28 | 26 |
| AL-07 | Artur Davis (D) | 44 | 36 | 46 | 2 | 14 | 25 | 20 | 14 | 25 |
| IL-08 | Melissa Bean (D) | 48 | 50 | 43 | 8 | 29 | 6 | 9 | 14 | 25 |
| TX-15 | Rubén Hinojosa (D) | 36 | 27 | 58 | 0 | 0 | 0 | 30 | 50 | 25 |
| AR-02 | Victor Snyder (D) | 17 | 9 | 50 | 0 | 14 | 6 | 55 | 28 | 22 |
| GA-13 | David Scott (D) | 32 | 23 | 50 | 2 | 14 | 18 | 9 | 28 | 22 |
| PA-14 | Michael Doyle (D) | 12 | 9 | 38 | 2 | 17 | 6 | 64 | 28 | 22 |
| TX-29 | Raymond Eugene Green (D) | 33 | 27 | 54 | 0 | 14 | 6 | 0 | 42 | 22 |
| SC-05 | John Spratt (D) | 44 | 23 | 43 | 2 | 0 | 12 | 18 | 28 | 21 |
| CT-04 | Christopher Shays (R) | 36 | 55 | 36 | 6 | 14 | 6 | 0 | 14 | 20 |
| TX-16 | Silvestre Reyes (D) | 36 | 14 | 42 | 0 | 0 | 6 | 40 | 28 | 20 |
| WI-07 | David Ross Obey (D) | 20 | 5 | 46 | 0 | 0 | 12 | 33 | 28 | 18 |
| ME-02 | Michael Michaud (D) | 12 | 18 | 36 | 0 | 14 | 12 | 36 | 14 | 17 |
| VA-09 | Frederick Boucher (D) | 36 | 23 | 42 | 0 | 14 | 12 | 0 | 14 | 17 |
| MD-04 | Albert Wynn (D) | 20 | 23 | 46 | 2 | 0 | 0 | 9 | 28 | 16 |
| OR-04 | Peter DeFazio (D) | 28 | 27 | 31 | 4 | 29 | 0 | 0 | 14 | 16 |
| KS-03 | Dennis Moore (D) | 23 | 23 | 46 | 2 | 0 | 6 | 10 | 14 | 15 |
| NY-21 | Michael McNulty (D) | 20 | 0 | 38 | 0 | 20 | 0 | N/A | 33 | 15 |
| PA-04 | Jason Altmire (D) | N/A | N/A | N/A | 0 | N/A | 31 | N/A | N/A | 15 |
| PA-10 | Chris Carney (D) | N/A | N/A | N/A | 6 | N/A | 25 | N/A | N/A | 15 |
| FL-17 | Kendrick Meek (D) | 8 | 23 | 36 | 2 | 14 | 6 | 9 | 16 | 14 |
| LA-02 | William Jefferson (D) | 35 | 50 | 31 | 2 | 0 | 0 | 0 | 0 | 14 |
| MD-02 | Dutch Ruppersberger (D) | 24 | 23 | 31 | 0 | 14 | 12 | 0 | 14 | 14 |
| MN-05 | Keith Ellison | 2 | 0 | 40 | 14 | |||||
| OR-05 | Darlene Hooley (D) | 24 | 23 | 31 | 2 | 14 | 6 | 0 | 14 | 14 |
| PA-01 | Robert Brady (D) | 16 | 23 | 36 | 2 | 14 | 0 | 9 | 14 | 14 |
| CA-43 | Joe Baca (D) | 20 | 14 | 36 | 0 | 0 | 6 | 18 | 14 | 13 |
| MS-02 | Bennie Thompson (D) | 30 | 18 | 43 | 0 | 0 | 0 | 0 | 14 | 13 |
| NC-01 | George Butterfield (D) | 16 | 18 | 29 | 0 | 14 | 0 | 18 | 14 | 13 |
| NY-27 | Brian Higgins (D) | 20 | 9 | 43 | 2 | 14 | 0 | 9 | 14 | 13 |
| PA-13 | Allyson Schwartz (D) | 16 | 9 | 36 | 2 | 14 | 6 | 0 | 28 | 13 |
| TX-09 | Al Green (D) | 20 | 23 | 36 | 2 | 0 | 0 | 9 | 14 | 13 |
| WA-09 | Adam Smith (D) | 21 | 14 | 31 | 2 | 20 | 6 | 0 | 14 | 13 |
| IN-09 | Baron Hill (D) | N/A | N/A | N/A | 6 | N/A | 18 | N/A | N/A | 12 |
| MD-07 | Elijah Cummings (D) | 8 | 9 | 36 | 2 | 14 | 6 | 9 | 14 | 12 |
| MO-03 | John Russell Carnahan (D) | 12 | 14 | 29 | 2 | 0 | 12 | 0 | 28 | 12 |
| NY-04 | Carolyn McCarthy (D) | 20 | 14 | 31 | 2 | 14 | 6 | 0 | 14 | 12 |
| NY-07 | Joseph Crowley (D) | 8 | 23 | 31 | 2 | 14 | 6 | 0 | 14 | 12 |
| TX-22 | Nick Lampson (D) | N/A | N/A | N/A | 0 | N/A | 25 | N/A | N/A | 12 |
| WA-02 | Rick Larsen (D) | 20 | 23 | 38 | 2 | 0 | 0 | 0 | 14 | 12 |
| FL-16 | Tim Mahoney (D) | N/A | N/A | N/A | 4 | N/A | 18 | N/A | N/A | 11 |
| MO-05 | Emanuel Cleaver (D) | 8 | 14 | 29 | 2 | 0 | 0 | 9 | 28 | 11 |
| NC-13 | R. Bradley Miller (D) | 17 | 5 | 36 | 2 | 14 | 6 | 0 | 14 | 11 |
| PA-02 | Chaka Fattah (D) | 8 | 14 | 29 | 2 | 14 | 0 | 9 | 14 | 11 |
| WA-03 | Brian Baird (D) | 20 | 24 | 21 | 2 | 0 | 0 | 9 | 14 | 11 |
| CA-01 | Michael Thompson (D) | 20 | 14 | 31 | 2 | 0 | 0 | 0 | 14 | 10 |
| CA-10 | Ellen Tauscher (D) | 12 | 18 | 23 | 2 | 14 | 0 | 0 | 14 | 10 |
| CA-53 | Susan Davis (D) | 8 | 14 | 31 | 2 | 14 | 0 | 0 | 14 | 10 |
| CO-02 | Mark Udall (D) | 16 | 14 | 31 | 2 | 0 | 6 | 0 | 14 | 10 |
| MO-01 | William Lacy Clay (D) | 16 | 27 | 14 | 2 | 0 | 0 | 9 | 14 | 10 |
| NJ-08 | William Pascrell (D) | 12 | 0 | 29 | 0 | 14 | 0 | 18 | 14 | 10 |
| NJ-12 | Rush Holt (D) | 5 | 9 | 29 | 0 | 17 | 6 | 0 | 14 | 10 |
| NY-02 | Steve Israel (D) | 12 | 14 | 21 | 0 | 0 | 6 | 0 | 28 | 10 |
| NY-06 | Gregory Meeks (D) | 8 | 23 | 31 | 2 | 0 | 6 | 0 | 14 | 10 |
| NY-10 | Edolphus Towns (D) | 8 | 14 | 31 | 0 | 0 | 6 | 0 | 28 | 10 |
| NY-14 | Carolyn Maloney (D) | 8 | 14 | 31 | 2 | 14 | 0 | 0 | 14 | 10 |
| SC-06 | James Clyburn (D) | 12 | 18 | 38 | 2 | 0 | 0 | 0 | 14 | 10 |
| VA-08 | James Moran (D) | 16 | 9 | 29 | 2 | 14 | 0 | 0 | 14 | 10 |
| AZ-04 | Ed Pastor (D) | 8 | 14 | 23 | 0 | 14 | 0 | 0 | 14 | 9 |
| CO-01 | Diana DeGette (D) | 4 | 5 | 31 | 2 | 14 | 6 | 0 | 14 | 9 |
| FL-03 | Corrine Brown (D) | 20 | N/A | 25 | 3 | 0 | 6 | 0 | 14 | 9 |
| IN-01 | Peter Visclosky (D) | 12 | 5 | 36 | 0 | 0 | 6 | 0 | 14 | 9 |
| MA-06 | John Tierney (D) | 8 | 14 | 23 | 2 | 14 | 0 | 0 | 14 | 9 |
| ME-01 | Thomas Allen (D) | 8 | 5 | 31 | 2 | 14 | 0 | 0 | 14 | 9 |
| MI-12 | Sander Levin (D) | 8 | 5 | 36 | 0 | 14 | 0 | 0 | 14 | 9 |
| NJ-01 | Robert Andrews (D) | 16 | 14 | 23 | 0 | 0 | 6 | 0 | 14 | 9 |
| OR-01 | David Wu (D) | 12 | 18 | 29 | 4 | 0 | 0 | 0 | 14 | 9 |
| TX-18 | Sheila Jackson Lee (D) | 16 | 14 | 25 | 2 | 0 | 6 | 0 | 14 | 9 |
| TX-30 | Eddie Bernice Johnson (D) | 16 | 18 | 23 | 2 | 0 | 0 | 0 | 14 | 9 |
| WA-01 | Jay Inslee (D) | 12 | 9 | 25 | 0 | 0 | 6 | 0 | 20 | 9 |
| WA-06 | Norman Dicks (D) | 8 | 9 | 36 | 2 | 0 | 6 | 0 | 14 | 9 |
| WI-03 | Ronald James Kind (D) | 25 | 23 | 23 | 2 | 0 | 6 | 0 | 0 | 9 |
| CA-29 | Adam Schiff (D) | 12 | 5 | 21 | 2 | 14 | 0 | 0 | 14 | 8 |
| CA-47 | Loretta Sanchez (D) | 12 | 14 | 23 | 2 | 0 | 0 | 0 | 14 | 8 |
| FL-23 | Alcee Hastings (D) | 8 | 9 | 21 | 0 | 0 | 6 | 9 | 14 | 8 |
| IL-01 | Bobby Rush (D) | 9 | 14 | 23 | 2 | 0 | 6 | 0 | 14 | 8 |
| MA-02 | Richard Neal (D) | 4 | 9 | 23 | 2 | 14 | 0 | 0 | 14 | 8 |
| MD-08 | Christopher Van Hollen (D) | 4 | 9 | 29 | 0 | 14 | 0 | 0 | 14 | 8 |
| MI-15 | John Dingell (D) | 13 | 9 | 31 | 2 | 0 | 0 | 0 | 14 | 8 |
| NJ-09 | Steven Rothman (D) | 8 | 9 | 17 | 2 | 14 | 6 | 0 | 14 | 8 |
| NY-09 | Anthony David Weiner (D) | 8 | N/A | 23 | 2 | 0 | 12 | 0 | 14 | 8 |
| NY-17 | Eliot Engel (D) | 4 | 5 | 29 | 2 | 0 | 6 | 9 | 14 | 8 |
| OH-11 | Stephanie Tubbs Jones (D) | 4 | 5 | 31 | 2 | 14 | 0 | 0 | 14 | 8 |
| OH-18 | Zack Space (D) | N/A | N/A | N/A | 4 | N/A | 12 | N/A | N/A | 8 |
| RI-01 | Patrick Kennedy (D) | 10 | 0 | 15 | 0 | 25 | 0 | 0 | 14 | 8 |
| TX-20 | Charles Gonzalez (D) | 16 | 18 | 23 | 0 | 0 | 0 | 0 | 14 | 8 |
| TX-25 | Lloyd Doggett (D) | 8 | 14 | 31 | 4 | 0 | 0 | 0 | 14 | 8 |
| WI-04 | Gwendolynne Moore (D) | 4 | 0 | 31 | 2 | 14 | 0 | 0 | 14 | 8 |
| CA-07 | George Miller (D) | 4 | 0 | 23 | 2 | 14 | 0 | 0 | 14 | 7 |
| CA-08 | Nancy Pelosi (D) | 8 | 0 | 31 | N/A | 0 | 0 | 0 | 14 | 7 |
| CA-27 | Brad Sherman (D) | 4 | N/A | 15 | 0 | 14 | 6 | 0 | 14 | 7 |
| CA-35 | Maxine Waters (D) | 4 | 9 | 15 | 2 | 14 | 0 | 0 | 14 | 7 |
| CA-51 | Bob Filner (D) | 12 | 14 | 17 | 2 | 0 | 0 | 0 | 14 | 7 |
| GA-05 | John Lewis (D) | 4 | 0 | 25 | 2 | 0 | 0 | 0 | 25 | 7 |
| IL-02 | Jesse Jackson (D) | 4 | 0 | 29 | 0 | 0 | 0 | 9 | 14 | 7 |
| IL-04 | Luis Gutierrez (D) | 4 | 0 | 30 | 4 | 0 | 0 | 0 | 25 | 7 |
| IL-05 | Rahm Emanuel (D) | 4 | 5 | 31 | 2 | 0 | 6 | 0 | 14 | 7 |
| MA-04 | Barney Frank (D) | 12 | 5 | 7 | 6 | 14 | 0 | 0 | 14 | 7 |
| MA-07 | Edward Markey (D) | 4 | 0 | 23 | 2 | 14 | 0 | 0 | 14 | 7 |
| MA-08 | Michael Capuano (D) | 8 | 0 | 21 | 0 | 14 | 0 | 0 | 14 | 7 |
| MA-10 | William Delahunt (D) | 12 | 9 | 8 | 7 | 0 | 6 | 0 | 14 | 7 |
| NC-04 | David Eugene Price (D) | 4 | 0 | 29 | 0 | 14 | 0 | 0 | 14 | 7 |
| NJ-06 | Frank Pallone (D) | 4 | 0 | 29 | 0 | 14 | 0 | 0 | 14 | 7 |
| NY-01 | Timothy Bishop (D) | 16 | 0 | 23 | 0 | 0 | 6 | 0 | 14 | 7 |
| OR-03 | Earl Blumenauer (D) | 8 | 5 | 25 | 6 | 0 | 0 | 0 | 14 | 7 |
| PA-08 | Patrick Murphy (D) | N/A | N/A | N/A | 8 | N/A | 6 | N/A | N/A | 7 |
| TX-23 | Ciro Rodriguez (D) | N/A | N/A | N/A | 2 | N/A | 12 | N/A | N/A | 7 |
| CA-14 | Anna Eshoo (D) | 4 | 14 | 17 | 4 | 0 | 0 | 0 | 14 | 6 |
| CA-34 | Lucille Roybal-Allard (D) | 4 | 5 | 23 | 0 | 0 | 6 | 0 | 14 | 6 |
| CA-36 | Jane Harman (D) | 12 | N/A | 17 | 2 | 0 | 0 | 0 | 14 | 6 |
| CA-38 | Grace Flores-Napolitano (D) | 8 | 0 | 23 | 0 | 0 | 6 | 0 | 14 | 6 |
| CT-01 | John Larson (D) | 8 | 0 | 29 | 2 | 0 | 0 | 0 | 14 | 6 |
| CT-03 | Rosa DeLauro (D) | 8 | 0 | 31 | 0 | 0 | 0 | 0 | 14 | 6 |
| FL-19 | Robert Wexler (D) | 8 | 0 | 23 | 4 | 0 | 0 | 0 | 14 | 6 |
| FL-20 | Debbie Wasserman-Schultz (D) | 4 | 0 | 21 | 0 | 14 | 0 | 0 | 14 | 6 |
| HI-01 | Neil Abercrombie (D) | 12 | 18 | 8 | 0 | 0 | 0 | 0 | 14 | 6 |
| MA-03 | James McGovern (D) | 4 | 0 | 23 | 2 | N/A | 0 | 0 | 14 | 6 |
| MD-05 | Steny Hoyer (D) | 4 | 0 | 21 | 2 | 14 | 0 | 0 | 14 | 6 |
| MI-13 | Carolyn Cheeks-Kilpatrick (D) | 4 | 5 | 23 | 2 | 0 | 0 | 0 | 14 | 6 |
| MI-14 | John Conyers (D) | 4 | 9 | 8 | 0 | 0 | 0 | 0 | 28 | 6 |
| MN-04 | Betty McCollum (D) | 4 | 5 | 31 | 0 | 0 | 0 | 0 | 14 | 6 |
| NM-03 | Tom Udall (D) | 4 | 5 | 23 | 0 | 0 | 6 | 0 | 14 | 6 |
| NV-01 | Shelley Berkley (D) | 13 | 5 | 14 | 2 | 0 | 0 | 0 | 14 | 6 |
| NY-05 | Gary Ackerman (D) | 8 | 14 | 15 | 2 | 0 | 0 | 0 | 14 | 6 |
| NY-18 | Nita Lowey (D) | 4 | 0 | 31 | 2 | 0 | 0 | 0 | 14 | 6 |
| AZ-07 | Raul Grijalva (D) | 4 | 0 | 8 | 0 | 0 | 0 | 0 | 28 | 5 |
| CA-05 | Doris Matsui (D) | 4 | 5 | 15 | 2 | 0 | 0 | 0 | 14 | 5 |
| CA-23 | Lois Capps (D) | 4 | 0 | 23 | 2 | 0 | 0 | 0 | 14 | 5 |
| CA-32 | Hilda Solis (D) | 4 | 0 | 23 | 2 | 0 | 0 | 0 | 14 | 5 |
| MA-01 | John Olver (D) | 4 | 0 | 14 | 0 | 14 | 0 | 0 | 14 | 5 |
| NC-12 | Melvin Watt (D) | 4 | 0 | 14 | 0 | 14 | 0 | 0 | 14 | 5 |
| NJ-10 | Donald Payne (D) | 4 | 0 | 15 | 0 | 14 | 0 | 0 | 14 | 5 |
| NY-08 | Jerrold Nadler (D) | 4 | 0 | 7 | 2 | 14 | 6 | 0 | 14 | 5 |
| NY-12 | Nydia Velazquez (D) | 4 | 5 | 15 | 0 | 0 | 6 | 0 | 14 | 5 |
| NY-15 | Charles Rangel (D) | 4 | 0 | 23 | 0 | 0 | 0 | 0 | 14 | 5 |
| NY-16 | Jose Serrano (D) | 4 | 0 | 14 | 0 | 0 | 6 | 9 | 14 | 5 |
| NY-28 | Louise McIntosh Slaughter (D) | 9 | 0 | 18 | 2 | 0 | 0 | 0 | 16 | 5 |
| OH-10 | Dennis Kucinich (D) | 4 | 0 | 8 | 0 | 0 | 6 | 0 | 28 | 5 |
| VA-03 | Robert Scott (D) | 4 | 0 | 7 | 2 | 14 | 0 | 0 | 14 | 5 |
| WI-02 | Tammy Baldwin (D) | 0 | 5 | 21 | 0 | 0 | 0 | 0 | 14 | 5 |
| AZ-05 | Harry Mitchell (D) | N/A | N/A | N/A | 2 | N/A | 6 | N/A | N/A | 4 |
| AZ-08 | Gabrielle Giffords (D) | N/A | N/A | N/A | 2 | N/A | 6 | N/A | N/A | 4 |
| CA-13 | Fortney Stark (D) | 4 | 0 | 8 | 3 | 0 | 6 | 0 | 14 | 4 |
| CA-17 | Sam Farr (D) | 4 | 0 | 15 | 2 | 0 | 0 | 0 | 14 | 4 |
| CA-28 | Howard Berman (D) | 8 | 0 | 8 | 2 | 0 | 6 | 0 | 14 | 4 |
| CA-30 | Henry Waxman (D) | 4 | 0 | 15 | 4 | 0 | 0 | 0 | 14 | 4 |
| CA-31 | Xavier Becerra (D) | 4 | 0 | 15 | 0 | 0 | 0 | 0 | 14 | 4 |
| CO-07 | Ed Perlmutter (D) | N/A | N/A | N/A | 2 | N/A | 6 | N/A | N/A | 4 |
| CT-02 | Joe Courtney (D) | N/A | N/A | N/A | 2 | N/A | 6 | N/A | N/A | 4 |
| FL-11 | Kathy Castor (D) | N/A | N/A | N/A | 2 | N/A | 6 | N/A | N/A | 4 |
| IL-07 | Danny Davis (D) | 8 | 9 | 17 | 2 | 0 | 0 | 0 | 0 | 4 |
| IL-17 | Phiip Hare (D) | N/A | N/A | N/A | 2 | N/A | 6 | N/A | N/A | 4 |
| KY-03 | John Yarmuth (D) | N/A | N/A | N/A | 2 | N/A | 6 | N/A | N/A | 4 |
| NH-01 | Carol Shea-Porter (D) | N/A | N/A | N/A | 2 | N/A | 6 | N/A | N/A | 4 |
| NY-11 | Yvette Clarke (D) | N/A | N/A | N/A | 3 | N/A | 6 | N/A | N/A | 4 |
| NY-20 | Kirsten Gillibrand (D) | N/A | N/A | N/A | 2 | N/A | 6 | N/A | N/A | 4 |
| NY-22 | Maurice Hinchey (D) | 4 | 5 | 9 | 0 | 0 | 0 | 0 | 14 | 4 |
| CA-06 | Lynn Woolsey (D) | 4 | 0 | 8 | 4 | 0 | 0 | 0 | 14 | 3 |
| CA-09 | Barbara Lee (D) | 4 | 0 | 8 | 2 | 0 | 0 | 0 | 14 | 3 |
| CA-15 | Michael Honda (D) | 4 | 0 | 8 | 2 | 0 | 0 | 0 | 16 | 3 |
| CA-16 | Zoe Lofgren (D) | 4 | 0 | 8 | 4 | 0 | 0 | 0 | 14 | 3 |
| CA-39 | Linda Sanchez (D) | 4 | 0 | 8 | 2 | 0 | 0 | 0 | 14 | 3 |
| CT-05 | Chris Murphy (D) | N/A | N/A | N/A | 0 | N/A | 6 | N/A | N/A | 3 |
| IL-09 | Janice Schakowsky (D) | 0 | 0 | 8 | 2 | 0 | 0 | 0 | 14 | 3 |
| KS-02 | Nancy Boyda (D) | N/A | N/A | N/A | 0 | N/A | 6 | N/A | N/A | 3 |
| MD-03 | John Sarbanes (D) | N/A | N/A | N/A | 0 | N/A | 6 | N/A | N/A | 3 |
| WA-07 | James McDermott (D) | 4 | 0 | 7 | 2 | 0 | 0 | 0 | 14 | 3 |
| WI-08 | Steve Kagen | 0 | 6 | 3 | ||||||
| CA-33 | Diane Watson (D) | 0 | 0 | 8 | 0 | 0 | 0 | 0 | 14 | 2 |
| NJ-13 | Albio Sires (D) | 0 | N/A | N/A | 2 | N/A | 6 | N/A | N/A | 2 |
| CA-11 | Jerry McNerney (D) | N/A | N/A | N/A | 2 | N/A | 0 | N/A | N/A | 1 |
| FL-22 | Ron Klein (D) | N/A | N/A | N/A | 2 | N/A | 0 | N/A | N/A | 1 |
| GA-04 | Hank Johnson (D) | N/A | N/A | N/A | 2 | N/A | 0 | N/A | N/A | 1 |
| IA-01 | Bruce Braley (D) | N/A | N/A | N/A | 2 | N/A | 0 | N/A | N/A | 1 |
| IA-02 | David Loebsack (D) | N/A | N/A | N/A | 2 | N/A | 0 | N/A | N/A | 1 |
| OH-13 | Betty Sutton (D) | N/A | N/A | N/A | 2 | N/A | 0 | N/A | N/A | 1 |
| PA-07 | Joe Sestak (D) | N/A | N/A | N/A | 2 | N/A | 0 | N/A | N/A | 1 |
| TN-09 | Steve Cohen (D) | N/A | N/A | N/A | 2 | N/A | 0 | N/A | N/A | 1 |
| CA-37 | Laura Richardson (D) | N/A | N/A | N/A | N/A | N/A | 0 | N/A | N/A | 0 |
| HI-02 | Mazie Hirono (D) | N/A | N/A | N/A | 0 | N/A | 0 | N/A | N/A | 0 |
| MA-05 | Niki Tsongas (D) | N/A | N/A | N/A | N/A | N/A | 0 | N/A | N/A | 0 |
| NH-02 | Paul Hodes (D) | N/A | N/A | N/A | 0 | N/A | 0 | N/A | N/A | 0 |
| NY-19 | John Hall (D) | N/A | N/A | N/A | 0 | N/A | 0 | N/A | N/A | 0 |
| NY-24 | Mike Arcuri (D) | N/A | N/A | N/A | 0 | N/A | 0 | N/A | N/A | 0 |
| VT-AL | Peter Welch (D) | N/A | N/A | N/A | 0 | N/A | 0 | N/A | N/A | 0 |
The polling results for all primaries and caucuses are available as a Web page and in .csv format.
Here are the delegate totals from various news sources rounded to integers (Democrats Abroad has 22 delegates, each with 1/2 vote). The sources differ because in most caucus states, no delegates to the national conventions have been chosen yet, just delegates to the district, county, or state convention so there is some guesswork involved. Furthermore, some of the unpledged delegates are elected at state conventions in May or June. Finally, the PLEOs (Party Leaders and Elected Officials) sometimes waver and may tell different reporters slightly different stories that they interpret differently.
Delegates
| Source | Clinton | Obama | BHO-HRC |
| Washington Post | 1593 | 1724 | +131 |
| NY Times | 1579 | 1721 | +142 |
| AP | 1595 | 1728 | +133 |
| CNN | 1589 | 1727 | +138 |
| ABC | 1590 | 1730 | +140 |
| CBS | 1586 | 1724 | +138 |
| MSNBC | 1599 | 1732 | +133 |
Needed to win: 2025
Here is another source for delegate totals.
-- The Votemaster