
Dem
50

Ties
1
GOP
49

A question of great interest to us is: "How did the pollsters do?" Let's take a look. The map on the left is our final prediction on Election Day. The map on the right is the current state of play. All the states have the final result except Georgia, which is shown as a tie here.
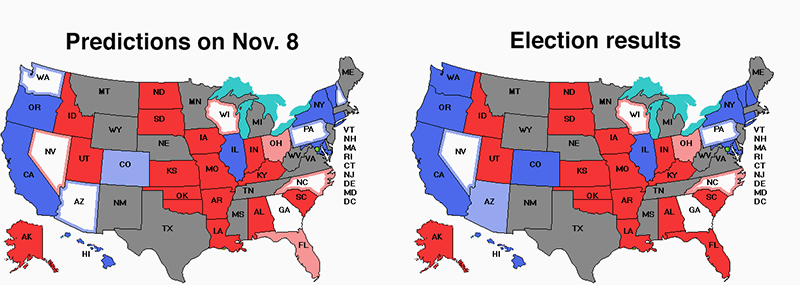
Can you spot the differences? We got Nevada wrong. A late InsiderAdvantage poll had Adam Laxalt (R) up by 6 points, but in the end he lost. In a couple of states the margin was slightly different from what we predicted, but no other states were called wrong. On the whole, the polls were pretty good. One of the differences we had with other aggregators is that we were not fooled but the large number of Republican consultants shoveling out fake polls at the last minute. We didn't use any of them.
Let's look at some of the details now. Our methodology is to examine all polls that had at least one day of polling on or after Oct. 1. Any poll that finished field research before Oct. 1 is considered too far from the election and not examined in this analysis. The polls were not weighted. For each of the 28 states that were polled in Oct./Nov. we took the most recent poll, irrespective of which pollster conducted the poll. This is an attempt to evaluate the polling industry as a whole rather than rate individual pollsters. We didn't include Alaska because its top-four system doesn't fit our model. So, we were down to 27. Here they are:
| |
|
Bias | |||||||
| State | Dem | GOP | Margin | Dem | GOP | Margin | Error | ||
| Arizona | 51% | 47% | 4% | 52% | 46% | 6% | -2% | ||
| Arkansas | 26% | 55% | -29% | 31% | 66% | -35% | 6% | ||
| California | 53% | 37% | 16% | 60% | 40% | 20% | -4% | ||
| Colorado | 51% | 43% | 8% | 55% | 42% | 13% | -5% | ||
| Connecticut | 56% | 41% | 15% | 58% | 42% | 16% | -1% | ||
| Florida | 44% | 54% | -10% | 41% | 58% | -17% | 7% | ||
| Georgia | 47% | 49% | -2% | 49% | 49% | 0% | -2% | ||
| Illinois | 58% | 40% | 18% | 56% | 43% | 13% | 5% | ||
| Indiana | 38% | 49% | -11% | 38% | 59% | -21% | 10% | ||
| Iowa | 41% | 53% | -12% | 44% | 56% | -12% | 0% | ||
| Kansas | 33% | 54% | -21% | 37% | 60% | -23% | 2% | ||
| Louisiana | 16% | 53% | -37% | 18% | 62% | -44% | 7% | ||
| Missouri | 40% | 55% | -15% | 42% | 55% | -13% | -2% | ||
| Nevada | 48% | 49% | -1% | 49% | 48% | 1% | -2% | ||
| New Hampshire | 48% | 45% | 3% | 54% | 44% | 10% | -7% | ||
| New York | 59% | 39% | 20% | 56% | 43% | 13% | 7% | ||
| North Carolina | 46% | 52% | -6% | 47% | 51% | -4% | -2% | ||
| Ohio | 46% | 51% | -5% | 47% | 53% | -6% | 1% | ||
| Oklahoma | 34% | 62% | -28% | 32% | 64% | -32% | 4% | ||
| Oregon | 51% | 34% | 17% | 56% | 41% | 15% | 2% | ||
| Oklahoma-special | 36% | 59% | -23% | 35% | 62% | -27% | 4% | ||
| Pennsylvania | 49% | 48% | 1% | 51% | 47% | 4% | -3% | ||
| South Dakota | 27% | 58% | -31% | 26% | 70% | -44% | 13% | ||
| Utah | 46% | 47% | -1% | 42% | 55% | -13% | 12% | ||
| Vermont | 62% | 28% | 34% | 68% | 28% | 40% | -6% | ||
| Washington | 48% | 46% | 2% | 57% | 43% | 14% | -12% | ||
| Wisconsin | 47% | 53% | -6% | 49% | 50% | -1% | -5% | ||
Columns 2-4 show the most recent poll in the state. Column 4 shows the predicted Democratic result. So -29% for Arkansas was a prediction of a Democratic loss by 29 points. Then come three columns giving the election result, where we have scored Georgia as a tie. "Margin" is the Democrat's actual margin. The final column is the predicted margin minus the actual margin. A positive score means the Republican did better than predicted, which could indicate that some Republican voters didn't want to talk to the pollsters. A negative score indicates that the Democrat outperformed the polls.
To take an example, the most recent poll in Arizona had Sen. Mark Kelly (D-AZ) ahead by 4 points. He actually won by 6 points, so the error is -2. A negative scores like that suggests there were no "shy Republicans" (or, at very least, that the pollsters managed to compensate for them). The average of all 27 rows was +1.04%, suggesting that if there were Republican refuseniks, the effect was only 1 point. Of the 27 states, 13 were negative, 13 were positive, and 1 was spot on. This suggests there wasn't a lot of bias because the errors are symmetric.
Then we tried that again, only using all 171 polls from Oct. 1 onward. In this condition, we often had many polls per state. The mean bias was +1.00, almost the same as before. There were 73 polls that were negative (Democrat outperformed the poll), 70 that were positive (Republican outperformed the poll), and 19 polls where the poll hit the nail on the head. Again, if there were shy Republicans, the effect was at most 1 point, and maybe there weren't very many at all and this is just statistical noise.
Maybe some pollsters were good and others were bad and they sort of canceled out, though? So we then looked at the top 10 pollsters by volume and examined their Oct. and Nov. polls. Here are the results.
| Pollster | Mean bias | Dem bias | No bias | GOP bias |
| Beacon+Shaw | -1.75% | 0 | 1 | 3 |
| Civiqs | 3.07% | 10 | 3 | 1 |
| Emerson | -0.57% | 12 | 0 | 9 |
| InsiderAdvantage | -4.30% | 1 | 0 | 6 |
| Marist Coll. | -0.29% | 2 | 3 | 2 |
| PPP | 1.75% | 3 | 0 | 1 |
| Research Co. | 1.27% | 4 | 1 | 6 |
| Siena Coll. | 3.25% | 5 | 2 | 1 |
| Suffolk U. | 1.00% | 2 | 0 | 1 |
| SurveyUSA | 1.70% | 5 | 0 | 1 |
A number of pollsters exhibited a small to moderate positive bias, which could be due to Republicans refusing to take part in polls. On the other hand, InsiderAdvantage had a very large bias the other way, possibly due to fudging the numbers to make people think Republicans were running away with it, which they weren't. These two effects may have canceled out to some extent. However, only 21 of the 319 polls in our database are from InsiderAdvantage, so this can't be the whole story. We had our doubts about Emerson College for a while, but in the end, Emerson did quite well. They have an A- from FiveThirtyEight. That seems about right.
So our final take is that there might have been some Republicans who refused to talk to the pollsters, possibly in the range of 1-2%, but it will take more research to try to figure this out. On the other hand, our averaging method nailed 48 states so far in terms of who won, so polling is not completely dead. And we said Georgia would be a tie and it kind of is, so we really hit on 49 states, and just missed on one (Nevada) due to a last-minute poll from InsiderAdvantage that had Laxalt way ahead.
Watch out for articles like this one in The Hill. It is entitled "Did the polls get it wrong again?" The answer is: "Yes, if you include all the junk polls many Republican consultants where shoveling out in the final week, but no, if you just include reputable pollsters." Celinda Lake, a Democratic pollster, is quoted in the article saying something really, really stupid. She said: "We never anticipated a deliberate flooding of the zone with polls that would show you [Republicans] in the lead. They're going to have to balance aggregation with okay we're going to use this many Republican-leaning polls and this many Democratic-leaning polls or something."
NO! NO! NO! Averaging including equal numbers of honest, but Democratic-leaning polls from the small colleges, Mason-Dixon, SurveyUSA, etc. and garbage polls made up by Republican consultants who want to make people think their candidates are ahead is not a good idea, Celinda. It is an unbelievably dumb, horrible, godawful stupid idea. A much better idea is just to ignore all the garbage polls.
Again, we'll have a couple more items on this general theme later this week. Lord knows how we'll find time and space for everything we've got planned. (V)