
Dem
47

GOP
53

CNN has another analysis of recent elections, comparing the three times Donald Trump was on the ballot—2016, 2020, and 2024. What is interesting is the breakdown by demographic group, based on the exit poll data, which is probably fairly accurate since the question is "How did you just vote?" and not "Are you planning to vote and if so, for whom?" Let's start with minority voters, as shown here:
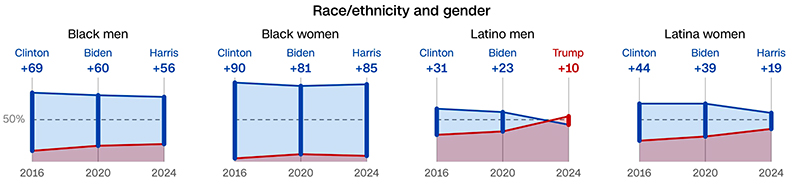
With Black men, Kamala Harris won, but her margin was a bit worse than Joe Biden's and also worse than Hillary Clinton's. It seems a bit odd that Black men liked an unpopular white woman more than a relatively popular Black woman. In contrast, Black women are hugely faithful to any Democrat. Nothing shakes their faith.
With Latino men it was a disaster. Harris underperformed Joe Biden by 33 points and underperformed Clinton by 41 points. That is a total rout and a complete rejection of Harris, especially since they were fine with a white woman and a white man. Latinas dropped off more than Black women, but still voted mostly for Harris. Among white men there wasn't much change in the three elections. Trump won by margins of 31, 23, and 22 points respectively. Trump also won white women three times, by margins of 9, 11, and 7 points, respectively. The message here is that the massive loss of Latino men was a killer.
Now let's look at the educational divide. Keep in mind that for generations, noncollege voters were Democrats and college-educated voters were Republicans. Here are the data:
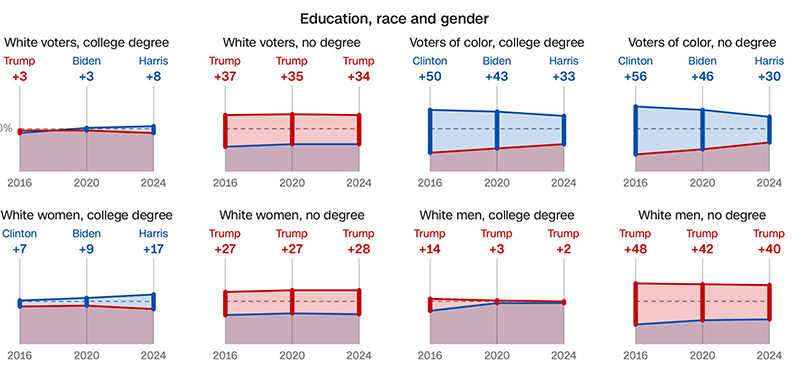
White college voters are about evenly split, with Harris doing a little better than Biden. In contrast, white noncollege voters are solidly for Trump with no change, regardless of his opponent. Somewhat surprisingly, both college and noncollege minorities preferred both a white woman and a white man to her.
White women, with or without college degrees, held steady. Those with college degrees liked all three Democrats, with Harris the slight favorite. Noncollege white women disliked all Democrats, didn't matter who. White men with college degrees liked Trump the first time, didn't appreciate what they got, and soured on him a bit later. White men without college degrees really, really don't like Democrats and it doesn't matter which Democrat it is. Democrats have a big problem with noncollege voters. If they want to do better in the future, they are really going to have to address this. As a bare minimum, they will feel compelled to nominate a white man in 2028.
By age, the shifts were small. The 18-29-year-olds liked Democrats in all three elections, but Harris the least of all. In other age ranges, the split was closer to even and close to constant over the years.
The article linked above slices and dices the voters other ways as well. The most interesting note is that moderates liked Democrats in all three elections, but liked Biden the best. Also, first-time voters went for Biden by +32 in 2020 but for Trump by +11 in 2024. That is a 43-point shift. Clearly, Trump did very well with low-propensity voters, but the results of this year's elections suggests that while these voters like Trump personally, that affection does not transfer to other Republicans. (V)