
Dem
50

Ties
1
GOP
49

There are many ways to look at how an election might go. There are polls, prediction markets, fundamentals, how it went in previous years, presidential approval, candidate quality, the generic House poll, the inflation rate, the change in the Dow Jones this year, direction-of-the-country polls, expert predictions and many other options that have some predictive value. It is possible to make a probabilistic model that takes all these factors into consideration and weights each one to come to a prediction for each race. Earlier in August, we discussed a model made by G. Elliott Morris, who replaced Nate Silver at FiveThirtyEight after ABC News did not renew Silver's contract.
Now Silver, like Morris, has struck out on his own and made a new model. He calls it FLIPR. If done right, it can be more accurate than just looking at one factor. Some of the things that matter, like candidate quality, are hard to quantify and feed into a computer, but candidate approval ratings can serve as a proxy. Other factors like the inflation rate, Dow Jones direction, and presidential approval are numeric to start with.
The tricky part about these models is how much to weight each factor. Is presidential approval more or less important than the generic House poll? What model makers do is start with some guesses then run the model on past elections. If using the data available on Aug. 17, 2020 doesn't do a good job predicting the (now known) 2020 Senate results, time to tweak the weights. It may take tens of thousands of trials to find the best set of weights. Then it is time to try the model on other years until the model maker is satisfied this is the best he can do. The use of different factors and different weights accounts for potential differences between different models. Also, unique events in a given cycle—wars, pandemics, mid-cycle redistricting, candidates dropping out in July, unpopular Supreme Court decisions, etc.—mess up all models because there is no way to calibrate how they affect the elections based on history.
Using the model, it is possible to ask questions like: "What is the probability of the Democrats controlling the House based on some assumed House popular vote?" Here is how Silver's model answers that question now. He runs the model every day with the then-current inputs, so this can and will change over time as Donald Trump's approval, the economy, and other inputs change:
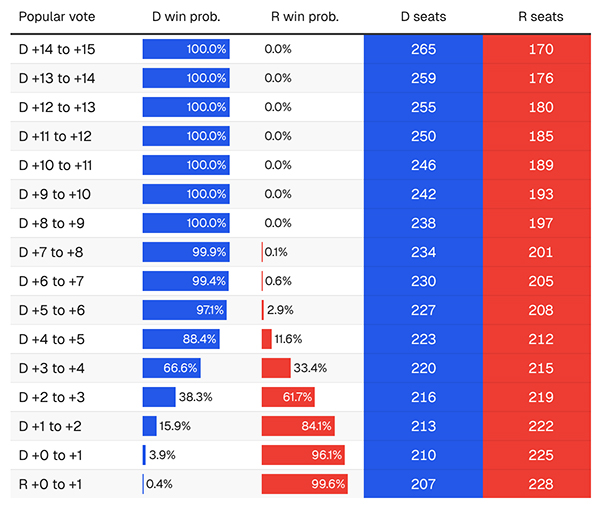
As you can see, if the Democrats win the House popular vote nationwide by at least 5 points, the probability of their capturing the House is 97%—that is, all but certain. But if the House popular vote is a tie, the probability of the Republicans keeping the House is 96%. This is largely due to the House Republican bias due to excessive gerrymandering. Democrats need to win the House popular vote by about 3 points to make the House a tossup.
Now on to the Senate. Here is the table:
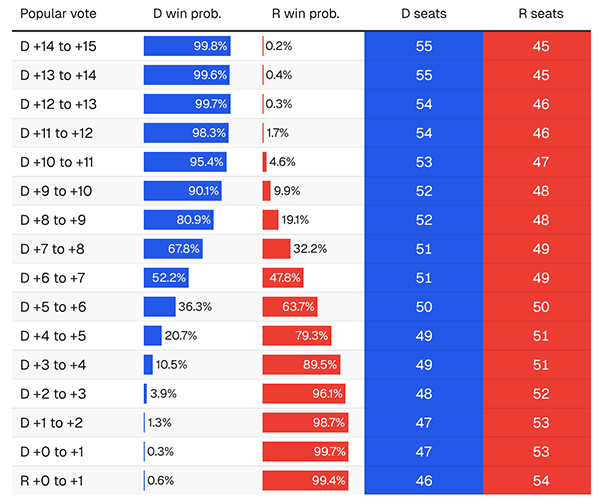
This is a tougher hill to climb for the Democrats because to get control of the Senate, they have to win deep into red territory, in places like Alaska (R+6), Iowa (R+6), Ohio (R+5) and Texas (R+6). For the House, all the Democrats have to do is win the competitive races. For the Senate, that is not enough. They have to beat Republican incumbents and challengers in heavily Republican territory. At a D+7 popular vote, the Democrats are the Senate favorites, but to get to a 90% probability, it would take a 9-point win in the popular vote. That is not impossible, but a steep hill to climb. For the Senate, however, candidate quality matters much more than for the House. A loathsome candidate like Ken Paxton (R-TX) could lose even if the Democrats don't run the table nationally. Predicting the Senate is trickier than predicting the House because the character of the individual candidates matters much more than for the House. Also, the model doesn't account for specific local factors, like the bribery scandal in Ohio that will soon be back in the news (due to a new trial) and may haunt Sen. Jon Husted (R-OH).
All in all, Silver's Senate model predicts a 57% chance of the Democrats capturing the Senate. This is close to the 55% Morris' model predicts. The details of the models are closely guarded secrets, but both Morris and Silver understand what factors are important, even if their simulations have produced somewhat different weights.
Silver's model also predicts individual Senate races. Here are the most likely pickups for both parties:
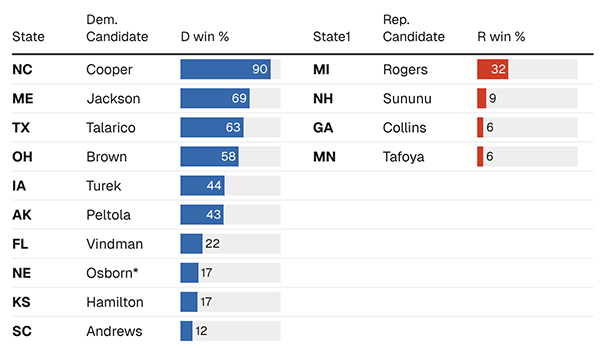
Clearly the polling plays a big role in the model. That is why Roy Cooper is almost a shoo-in in North Carolina while Troy Jackson is not in Maine, despite Maine being bluer (D+4) than North Carolina (R+1). In the model, Dan Osborn (I) in Nebraska counts as a Democrat since there is no actual Democrat in the race.
As an aside, Silver has three versions of the model roughly as follows:
Today and going forward, we will cite only the deluxe model. The "Lite" model just uses polls, which doesn't add much to our model and map. The "Classic" model throws in more, but as time goes on and Silver gets more data and experience, why not take advantage of it and use his most recent model? (V)