| Aug. 08 | |
|
|
|
|
|
| Presidential polls today: | (None) | |
| Dem pickups (vs. 2004): | (None) | |
| GOP pickups (vs. 2004): | (None) |
News from the Votemaster
Here is more data from CQ Politics on how well the 42 new House freshmen Democrats are doing at fundraising. Since they were swept in in the 2006 tidal wave, they could be vulnerable in 2008. All of these Democrats either defeated an incumbent Republican or won an open seat in 2006. No Republican challenger defeated a Democratic incumbent in 2006.
This chart gives a first clue to where the House action will be in 2008. Any Democrat with oodles of money is going to (1) be tough to beat and (2) scare off top-tier Republican challengers. For example, Kirsten Gillibrand is in a Republican district, but with so much money in the bank, any Republican will think twice about taking her on, especially if this means giving up a safe seat in the state legislature.
On the other hand, Yvette Clark has under 50,000 in the bank. But she got 90% of the vote in 2006 and Kerry carried her district by 73% in 2004. She doesn't need any money. She just has to show up.
In the table below, the blue lines are districts that Kerry won in 2004; the red lines are districts that Bush won. The blue lines near the top of the table are probably safe for the incumbent (Democratic district and rich incumbent Democrat). The red lines near the bottom of the table (Republican district and a poor Democratic incumbent) are going to be the Republicans' top targets. These include Charlie Wilson (OH-06), Carol Shea-Porter ( NH-01 ), Michael Arcuri ( NY-24 ), and Steve Kagen ( WI-08 ). For comparison purposes, the median receipts for the first half of 2007 for all House members was about $250,000. Of the new freshmen Democrats, only Charlie Wilson is below that.
The third column shows what fraction of the vote the incumbent representative got in 2006 and the fourth column shows which party won the district in 2004, so R+8 means Bush won by 8% in 2004.
| Representative | CD | 2006 House | Kerry-Bush | Receipts | Spending | Cash June 30 |
| Kirsten Gillibrand | NY-20 | 53% | R+8 | $1,387,705 | $302,162 | $1,129,507 |
| Joe Sestak | PA-07 | 56% | D+6 | $976,107 | $114,456 | $1,072,436 |
| Ron Klein | FL-22 | 51% | D+2 | $1,258,093 | $244,116 | $1,014,964 |
| Patrick Murphy | PA-08 | 50% | D+3 | $1,127,818 | $180,719 | $964,821 |
| Gabrielle Giffords | AZ-08 | 54% | R+7 | $908,494 | $108,685 | $941,489 |
| Christopher Murphy | CT-05 | 56% | D+0 | $834,272 | $104,328 | $780,646 |
| Tim Mahoney | FL-16 | 50% | R+10 | $867,405 | $159,558 | $763,336 |
| John Hall | NY-19 | 51% | R+8 | $769,633 | $166,493 | $665,931 |
| Jerry McNerney | CA-11 | 53% | R+9 | $823,293 | $209,070 | $662,545 |
| Joe Courtney | CT-02 | 50% | D+10 | $626,044 | $123,106 | $558,706 |
| Ciro Rodriguez | TX-23 | 54% | R+14 | $473,168 | $122,827 | $549,371 |
| Baron Hill | IN-09 | 50% | R+19 | $631,902 | $122,995 | $543,989 |
| Harry Mitchell | AZ-05 | 50% | R+9 | $590,603 | $80,918 | $530,680 |
| Jason Altmire | PA-04 | 52% | R+9 | $615,010 | $155,730 | $514,110 |
| Tim Walz | MN-01 | 53% | R+4 | $635,545 | $211,048 | $502,601 |
| Heath Shuler | NC-11 | 54% | R+14 | $524,122 | $98,467 | $470,108 |
| John Yarmuth | KY-03 | 51% | D+2 | $552,538 | $122,608 | $455,979 |
| Peter Welch | VT-AL | 53% | D+20 | $179,886 | $56,249 | $451,987 |
| Christopher Carney | PA-10 | 53% | R+20 | $535,608 | $108,075 | $445,060 |
| Nick Lampson | TX-22 | 52% | R+29 | $507,927 | $223,210 | $441,049 |
| Zack Space | OH-18 | 62% | R+15 | $542,363 | $130,672 | $439,148 |
| Brad Ellsworth | IN-08 | 61% | R+24 | $499,360 | $94,558 | $432,418 |
| Joe Donnelly | IN-02 | 54% | R+13 | $646,255 | $236,622 | $411,327 |
| Paul Hodes | NH-02 | 53% | D+5 | $550,254 | $170,134 | $391,813 |
| John Sarbanes | MD-03 | 64% | D+9 | $474,297 | $152,552 | $388,736 |
| Nancy Boyda | KS-02 | 51% | R+20 | $374,471 | $62,100 | $346,903 |
| Ed Perlmutter | CO-07 | 55% | D+3 | $473,741 | $186,433 | $338,309 |
| Steve Kagen | WI-08 | 51% | R+11 | $372,165 | $87,841 | $336,725 |
| Michael Arcuri | NY-24 | 54% | R+6 | $418,208 | $128,426 | $325,289 |
| Mazie Hirono | HI-02 | 61% | D+12 | $366,388 | $127,461 | $295,701 |
| Carol Shea-Porter | NH-01 | 51% | R+3 | $262,541 | $75,744 | $255,511 |
| Steve Cohen | TN-09 | 60% | D+41 | $136,674 | $10,703 | $254,910 |
| Dave Loebsack | IA-02 | 51% | D+11 | $293,945 | $75,544 | $251,654 |
| Bruce Braley | IA-01 | 55% | D+7 | $212,874 | $104,723 | $220,445 |
| Charlie Wilson | OH-06 | 62% | R+1 | $227,637 | $80,956 | $206,364 |
| Kathy Castor | FL-11 | 70% | D+20 | $136,849 | $93,309 | $194,987 |
| Keith Ellison | MN-05 | 56% | D+43 | $216,450 | $45,506 | $179,865 |
| Phil Hare | IL-17 | 57% | D+3 | $220,837 | $126,477 | $150,485 |
| Betty Sutton | OH-13 | 61% | D+12 | $141,470 | $84,307 | $63,622 |
| Albio Sires | NJ-13 | 79% | D+37 | $226,874 | $186,535 | $57,464 |
| Yvette Clarke | NY-11 | 90% | D+73 | $105,617 | $98,816 | $49,027 |
| Hank Johnson | GA-04 | 75% | D+44 | $110,335 | $100,248 | $21,926 |
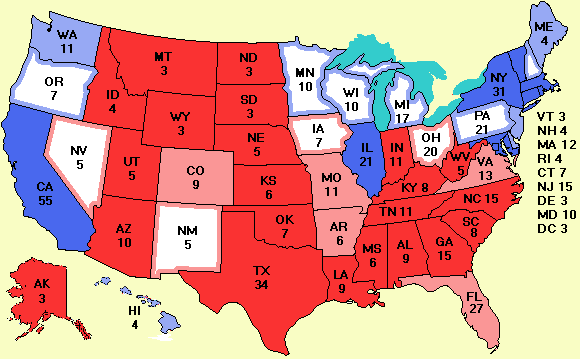
This page is the prototype for 2008. The data and map will refer to previous elections until serious polls begin in 2008. The blog will be updated when there is interesting news about the 2008 races.
Preview of the 2008 races: President Senate HouseThis map shows the current governors. Put your mouse on a state for more information.

This map shows the current Senate. Put your mouse on a state for more information.

This map shows the current House. Put your mouse on a state for more information.

-- The Votemaster