Analysis of the Pollsters
Permalink
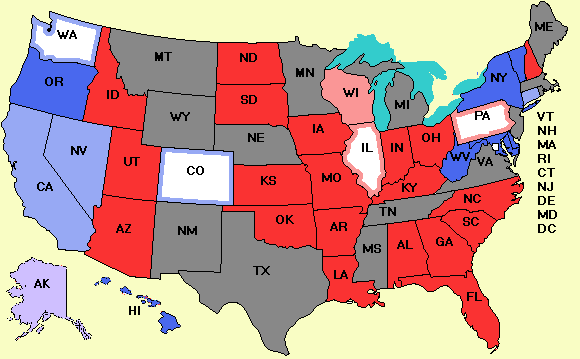
We know who won each race now (except for the governorships in Connecticut and Minnesota and about 7-10
House races), but do we know who won the pollster war? Which pollster(s) were on target and which were not?
There are many ways one can analyze the pollsters. Here is ours.
First, only pollsters who published at least 10 polls taken in October and November
were examined. The others are too small to bother with. Second, only the final poll in each state was
used in the analysis. For example, Rasmussen published four polls of the California Senate race in October,
but only the final one was used. Third, only Senate races were examined (simply because we have all the
Senate data entered in the data base and the House data is too sparse to mean much). We didn't enter the
data for the gubernatorial races.
So with these ground rules, the table below shows the "Democrat minus Republican" score for the election and
the nine pollsters being evaluated. For example, the score for California is +9% because Barbara Boxer (D)
beat Carly Fiorina (R) 52% to 43%. Similarly, the election score for Illinois is -2% because
Alexi Giannoulias (D) lost to Mark Kirk (R) 46% to 48%.
In other words, a positive score means the Democrat won or the polls predicted a Democratic victory and a
negative score means the Republican won or was predicted to win. In this table, blue means the Democrat
won or was predicted to win and red means the Republican won or was predicted to win.
When a pollster's color in any row differs from the "Election" column, it means the pollster called the
election wrong. Colorado, Nevada, and Washington have quite a bit of this mismatch.
A 0 means the pollster predicted a tie.
For the sake of uniformity, the numbers for Alaska and Florida are also the Democrat minus Republican
numbers, despite the presence of independents in the races.
The New York race is Kirsten Gillibrand's, not Chuck Schumer's, which is not listed (and which
practically nobody polled).
| Alaska |
-9% |
-8% |
-7% |
|
|
|
-14% |
|
|
|
| Arizona |
-24% |
-20% |
-18% |
|
|
|
|
|
|
|
| Arkansas |
-19% |
-19% |
|
|
|
|
-14% |
|
-21% |
|
| California |
+9% |
+3% |
+4% |
+4% |
+8% |
+4% |
+5% |
|
|
|
| Colorado |
+1% |
-4% |
-1% |
-4% |
0 |
+1% |
-1% |
|
|
-4% |
| Connecticut |
+8% |
+7% |
+11% |
+11% |
|
+10% |
+13% |
+9% |
|
|
| Delaware |
+17% |
+11% |
|
+16% |
+21% |
|
+19% |
|
|
|
| Florida |
-29% |
-34% |
-26% |
|
|
-24% |
-26% |
-27% |
-24% |
|
| Georgia |
-20% |
-30% |
|
|
-24% |
|
|
|
-23% |
|
| Hawaii |
+55% |
+13% |
+36% |
|
|
|
|
|
|
|
| Idaho |
-50% |
|
|
|
|
|
|
|
-44% |
|
| Illinois |
-2% |
-4% |
-4% |
-4% |
|
+3% |
|
|
-2% |
|
| Indiana |
-15% |
-18% |
|
|
-22% |
|
|
|
|
|
| Kansas |
-44% |
|
|
|
-40% |
|
|
|
|
|
| Kentucky |
-12% |
-12% |
-15% |
-7% |
-9% |
-8% |
-7% |
|
-5% |
|
| Maryland |
+25% |
+18% |
|
|
|
|
|
|
|
|
| Missouri |
-16% |
-9% |
-5% |
-6% |
|
-11% |
-13% |
|
-9% |
|
| Nevada |
+5% |
-4% |
-1% |
-3% |
|
-2% |
-4% |
|
-4% |
|
| New Hampshire |
-23% |
-15% |
-15% |
|
|
|
|
|
|
|
| New York B |
+26% |
+21% |
|
|
+20% |
+23% |
+14% |
+23% |
|
+15% |
| North Carolina |
-12% |
-14% |
-12% |
|
-15% |
|
|
|
|
|
| North Dakota |
-54% |
-47% |
|
|
|
|
|
|
|
|
| Ohio |
-18% |
-24% |
-18% |
-17% |
-15% |
-13% |
-15% |
-19% |
|
|
| Oregon |
+15% |
+11% |
+16% |
|
+25% |
|
|
|
|
|
| Pennsylvania |
-2% |
-4% |
-5% |
|
|
-4% |
-4% |
-5% |
|
-7% |
| South Carolina |
-35% |
-37% |
|
|
|
|
|
|
|
|
| Utah |
-30% |
-33% |
|
|
|
|
|
|
-16% |
|
| Vermont |
+33% |
|
|
|
|
|
|
|
+34% |
|
| Washington |
+2% |
-1% |
-2% |
+2% |
0 |
+3% |
+8% |
|
|
+1% |
| West Virginia |
+11% |
+4% |
+5% |
-2% |
|
|
0 |
|
|
|
| Wisconsin |
-7% |
-7% |
-9% |
|
|
-6% |
-8% |
|
|
-7% |
The next table shows how far from the final result each pollster was.
The number in each cell is the pollster's number in the above table minus the election results.
For example, Rasmussen predicted the Democrat in Arizona would lose by 20 points but he actually
lost by 24 points, so here Rasmussen was biased by 4 points in favor of the Democrat. For this
reason the box is colored blue (= bias in favor of the Democrats). In contrast, in California,
Rasmussen predicted the Democrat would win by 3 points and she won by 9 points, so here his
bias was 6 points in favor of the Republican, shown by a red box and a negative number.
All the information in the following table was computed using the table above.
| Alaska |
+1% |
+2% |
|
|
|
-5% |
|
|
|
| Arizona |
+4% |
+6% |
|
|
|
|
|
|
|
| Arkansas |
+0% |
|
|
|
|
+5% |
|
-2% |
|
| California |
-6% |
-5% |
-5% |
-1% |
-5% |
-4% |
|
|
|
| Colorado |
-5% |
-2% |
-5% |
-1% |
+0% |
-2% |
|
|
-5% |
| Connecticut |
-1% |
+3% |
+3% |
|
+2% |
+5% |
+1% |
|
|
| Delaware |
-6% |
|
-1% |
+4% |
|
+2% |
|
|
|
| Florida |
-5% |
+3% |
|
|
+5% |
+3% |
+2% |
+5% |
|
| Georgia |
-10% |
|
|
-4% |
|
|
|
-3% |
|
| Hawaii |
-42% |
-19% |
|
|
|
|
|
|
|
| Idaho |
|
|
|
|
|
|
|
+6% |
|
| Illinois |
-2% |
-2% |
-2% |
|
+5% |
|
|
+0% |
|
| Indiana |
-3% |
|
|
-7% |
|
|
|
|
|
| Kansas |
|
|
|
+4% |
|
|
|
|
|
| Kentucky |
+0% |
-3% |
+5% |
+3% |
+4% |
+5% |
|
+7% |
|
| Maryland |
-7% |
|
|
|
|
|
|
|
|
| Missouri |
+7% |
+11% |
+10% |
|
+5% |
+3% |
|
+7% |
|
| Nevada |
-9% |
-6% |
-8% |
|
-7% |
-9% |
|
-9% |
|
| New Hampshire |
+8% |
+8% |
|
|
|
|
|
|
|
| New York (K.G.) |
-5% |
|
|
-6% |
-3% |
-12% |
-3% |
|
-11% |
| North Carolina |
-2% |
+0% |
|
-3% |
|
|
|
|
|
| North Dakota |
+7% |
|
|
|
|
|
|
|
|
| Ohio |
-6% |
+0% |
+1% |
+3% |
+5% |
+3% |
-1% |
|
|
| Oregon |
-4% |
+1% |
|
+10% |
|
|
|
|
|
| Pennsylvania |
-2% |
-3% |
|
|
-2% |
-2% |
-3% |
|
-5% |
| South Carolina |
-2% |
|
|
|
|
|
|
|
|
| Utah |
-3% |
|
|
|
|
|
|
+14% |
|
| Vermont |
|
|
|
|
|
|
|
+1% |
|
| Washington |
-3% |
-4% |
+0% |
-2% |
+1% |
+6% |
|
-2% |
-1% |
| West Virginia |
-7% |
-6% |
-13% |
|
|
-11% |
|
|
|
| Wisconsin |
+0% |
-2% |
|
|
+1% |
-1% |
|
|
+0% |
| |
| Mean bias |
-4.0% |
-0.9% |
-1.3% |
+0.0% |
+0.8% |
-0.8% |
-0.7% |
+2.0% |
-3.7% |
| Mean error |
+6.0% |
+4.5% |
+4.8% |
+4.0% |
+3.5% |
+4.9% |
+2.0% |
+5.1% |
+4.4% |
The last two lines above are the final call. The bias row is the average of all the numbers above it.
For example, on average, Rasmussen's polls were 4 points more Republican than the actual election results
and PPP's polls were 0.9 points more Republican than the election. The least biased pollster was SurveyUSA,
whose average deviation was 0, favoring neither party.
The bottom line is the mean error, that is, how far off the mark the pollster was on average.
This number is different from the bias as can be seen from this (hypothetical) example. Suppose
a pollster polled only two states, Illinois and Nevada. In Illinois, the pollster's result was 10
points more favorable to the Democrat than the election results but in Nevada it was 10 points more
favorable to the Republican. The bias is then 0, meaning the pollster is not "cheating," either
intentionally or due to poor methodology. But the pollster is still awful in the sense the average
poll is off by 10 points. (In mathematical terms, the bias line is the arithmetic mean of the
lines above it whereas the error line is the arithmetic mean of the absolute values of the lines above it).
The conclusion of this simple study is that Rasmussen was the most biased and least accurate pollster
(although a lot of that came from one horrendous poll in Hawaii). SurveyUSA was the least biased and
Quinnipiac University was the most accurate.
Also noteworthy is that six of the nine pollsters had a Republican bias averaging 1.9%, possibly due to
the issues around cell phones (although Opinion Research and the two colleges use live interviewers).
Only two of the nine had a Democratic bias. This effect is of note for sites (like this one) that
average polls willy nilly (but at least we don't count internal polls, which have a lot more serious issues).
White House Expecting at least Half a Billion Dollars in Attack Ads in 2012
Permalink
After watching outside groups pour $200 million into attack ads against Democrats in 2010,
the White House is expecting this to be merely a warm-up exercise, with something like
$500 million to a $1 billion to be spent attacking them
in 2012.
To counter this, the Democrats are starting their fundraising already. Of course, what they should have done
as soon as the Supreme Court allowed corporations to spend money on political ads was pass a law requiring
these corporations to require their stockholders to approve the spending in advance. Public opinion
strongly opposed corporations buying attack ads, but now it is too late.
William Saletan of Slate wrote an interesting
piece
about who won. The conventional wisdom
is that politics is about who is in power. He disagrees and says politics is about using power.
By that measure the Democrats won--they got one of their top priorities, health-insurance reform--written
into law. Congressional majorities come and go (witness the turnaround between 2006 and 2008), but once
a major law is passed, even with a lot of opposition--think Social Security and Medicare--it is almost
never repealed. It can and will be tweaked around the edges, but even if a Republican is elected President
and the Republicans capture Congress in 2012, do they really want to
- Re-open the "donut hole" for seniors' drug benefits?
- Allow insurance companies to cancel policies after people get sick?
- Refuse to insure critically ill children?
- Kick 18-25 year-olds who can't get insurance off their parents' policies?
Probably not. Talking about these things during a campaign is one thing. Actually doing them is
something quite different. Remember, while the exit polls showed the public split evenly on repeal,
other polls have consistently shown that the public overwhelmingly approves all of the above provisions.
Of course, this is inconsistent, but few voters actually know what the law does.
If the Democrats hang onto the White House or one branch of Congress
in 2012 (when Democratic turnout will be far higher than it was this year), repeal will be impossible
until 2017, at which time the entire law will have kicked in and
repeal will be completely impossible (see: George Bush's attempt to phase out Social Security in 2004).
If you like this Website, tell your friends. You can also share by clicking this button

-- The Votemaster
|
Your donation is greatly appreciated. It will buy ads to publicize the site.

|